> ## Documentation Index
> Fetch the complete documentation index at: https://docs.markifact.com/llms.txt
> Use this file to discover all available pages before exploring further.
# Runs & Logs
> Understand Markifact workflow execution history, logs, and how long your run data is retained based on your plan.
Every time a workflow executes, Markifact creates a **run** record with detailed logs and results. This helps you monitor performance, debug issues, and track your automation history.
***
## Where to View Runs
### 1. Logs Sidebar (Live Debugging)
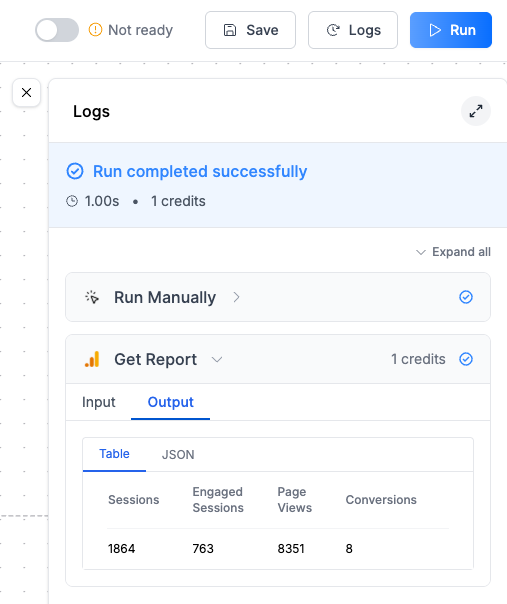
When running a workflow manually from the canvas editor:
* Click **Run Manually** button
* The **Logs sidebar** opens automatically
* Shows real-time execution progress
* Click any node to see its input/output details
 ### 2. Workflow Runs Page (Historical View)
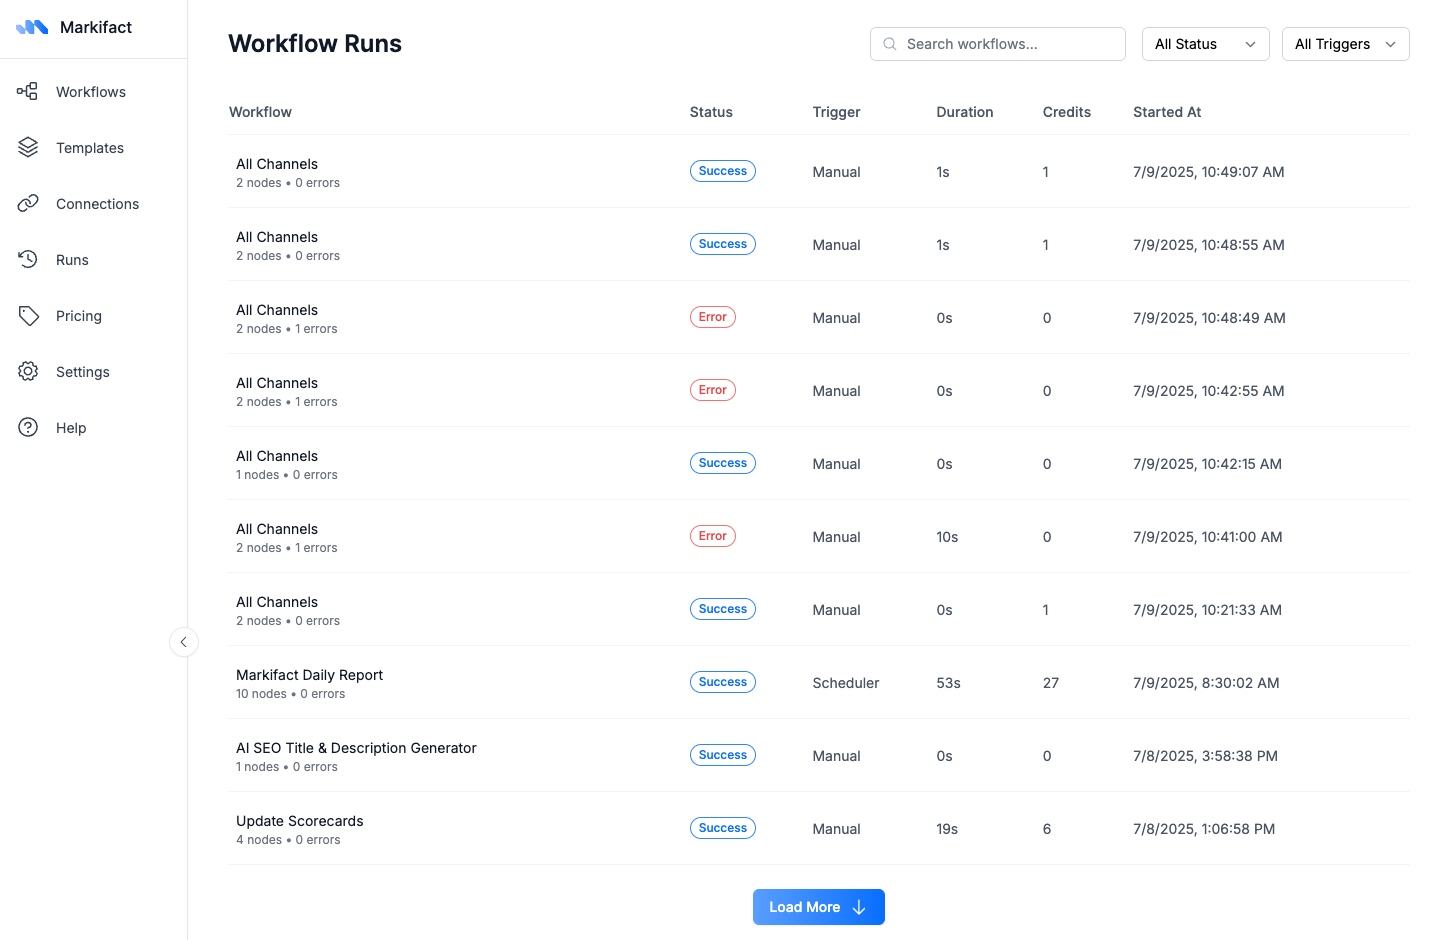
For all workflow executions (manual and triggered):
* Navigate to **Runs** in the left sidebar
* See complete execution history across all workflows
* Filter by status, trigger type, or workflow name
* Access detailed logs for any past run
##
### 2. Workflow Runs Page (Historical View)
For all workflow executions (manual and triggered):
* Navigate to **Runs** in the left sidebar
* See complete execution history across all workflows
* Filter by status, trigger type, or workflow name
* Access detailed logs for any past run
##  ## Run Information
Each run record includes:
| Field | Description |
| -------------- | --------------------------------------------------------- |
| **Status** | Success, Error, or Running |
| **Trigger** | How the workflow started (Manual, Scheduler, Slack, etc.) |
| **Duration** | Total execution time |
| **Credits** | Credits consumed during the run |
| **Started At** | Timestamp when execution began |
| **Nodes** | Number of nodes executed and any errors |
***
## Failure Notifications
When a workflow fails, you'll receive an **email notification** with:
* **Error summary** - Brief description of what went wrong
* **Failed node** - Which specific node encountered the error
* **Workflow name** - So you know which automation needs attention
The email will direct you to check the **Runs page** for detailed logs and troubleshooting information.
> 💡 **Pro tip**: The email gives you a quick overview, but always check the Runs page for complete error details and debugging information.
***
## Log Details
Click any run to see detailed execution logs:
### Node-Level Logs
* **Input**: Data that entered each node
* **Output**: Data produced by each node
* **Table/JSON views**: Switch between formats for easier reading
* **Error details**: Specific error messages and troubleshooting info
### Execution Flow
* See which nodes executed successfully
* Identify where workflows stopped or failed
* Track data transformation through each step
***
## History Retention
Your execution history is kept based on your plan:
| Plan | History Kept |
| -------- | ------------ |
| **Free** | 1 day |
| **Pro** | 7 days |
| **Team** | 30 days |
After this period, execution logs are automatically deleted to keep your workspace clean.
> 💡 **Tip**: Download important logs or results before they expire if you need them for longer-term analysis.
***
## Common Use Cases
### Debugging Workflows
* Check the **Logs sidebar** when a workflow fails
* Look for red error indicators on specific nodes
* Review input/output data to identify issues
### Performance Monitoring
* Track execution duration trends
* Monitor credit usage patterns
* Identify slow or expensive nodes
### Data Validation
* Verify correct data is flowing between nodes
* Confirm transformations are working as expected
***
## FAQ
Logs are automatically deleted based on your plan's retention period:
* Free: 1 day
* Pro: 7 days
* Team: 30 days
Upgrade your plan to keep logs longer, or download important data before it expires.
**Logs sidebar**: Real-time view when manually running workflows from the editor. Great for debugging and development.
**Runs page**: Historical view of all executions (manual and triggered). Better for monitoring and analysis.
Runs that fail before executing any nodes, or workflows that only use free operations (like simple data transformations), may show 0 credits consumed.
On the Runs page:
1. Use the search bar to find workflows by name
2. Filter by "All Triggers" to see specific trigger types
3. Look at the "Workflow" column to identify runs
This shows the total number of nodes in the workflow and how many encountered errors during execution. For example, "5 nodes • 1 error" means 5 nodes total, with 1 node failing.
## Run Information
Each run record includes:
| Field | Description |
| -------------- | --------------------------------------------------------- |
| **Status** | Success, Error, or Running |
| **Trigger** | How the workflow started (Manual, Scheduler, Slack, etc.) |
| **Duration** | Total execution time |
| **Credits** | Credits consumed during the run |
| **Started At** | Timestamp when execution began |
| **Nodes** | Number of nodes executed and any errors |
***
## Failure Notifications
When a workflow fails, you'll receive an **email notification** with:
* **Error summary** - Brief description of what went wrong
* **Failed node** - Which specific node encountered the error
* **Workflow name** - So you know which automation needs attention
The email will direct you to check the **Runs page** for detailed logs and troubleshooting information.
> 💡 **Pro tip**: The email gives you a quick overview, but always check the Runs page for complete error details and debugging information.
***
## Log Details
Click any run to see detailed execution logs:
### Node-Level Logs
* **Input**: Data that entered each node
* **Output**: Data produced by each node
* **Table/JSON views**: Switch between formats for easier reading
* **Error details**: Specific error messages and troubleshooting info
### Execution Flow
* See which nodes executed successfully
* Identify where workflows stopped or failed
* Track data transformation through each step
***
## History Retention
Your execution history is kept based on your plan:
| Plan | History Kept |
| -------- | ------------ |
| **Free** | 1 day |
| **Pro** | 7 days |
| **Team** | 30 days |
After this period, execution logs are automatically deleted to keep your workspace clean.
> 💡 **Tip**: Download important logs or results before they expire if you need them for longer-term analysis.
***
## Common Use Cases
### Debugging Workflows
* Check the **Logs sidebar** when a workflow fails
* Look for red error indicators on specific nodes
* Review input/output data to identify issues
### Performance Monitoring
* Track execution duration trends
* Monitor credit usage patterns
* Identify slow or expensive nodes
### Data Validation
* Verify correct data is flowing between nodes
* Confirm transformations are working as expected
***
## FAQ
Logs are automatically deleted based on your plan's retention period:
* Free: 1 day
* Pro: 7 days
* Team: 30 days
Upgrade your plan to keep logs longer, or download important data before it expires.
**Logs sidebar**: Real-time view when manually running workflows from the editor. Great for debugging and development.
**Runs page**: Historical view of all executions (manual and triggered). Better for monitoring and analysis.
Runs that fail before executing any nodes, or workflows that only use free operations (like simple data transformations), may show 0 credits consumed.
On the Runs page:
1. Use the search bar to find workflows by name
2. Filter by "All Triggers" to see specific trigger types
3. Look at the "Workflow" column to identify runs
This shows the total number of nodes in the workflow and how many encountered errors during execution. For example, "5 nodes • 1 error" means 5 nodes total, with 1 node failing.