> ## Documentation Index
> Fetch the complete documentation index at: https://docs.markifact.com/llms.txt
> Use this file to discover all available pages before exploring further.
# Combine Multi-Platform Ad Data for Google Slides
> Learn how to blend data from Google Ads, Meta Ads, LinkedIn Ads, and other platforms into unified tables and insights for your slide presentations.
Building comprehensive marketing reports means combining data from multiple advertising platforms. Instead of managing separate Google Ads, Meta Ads, and LinkedIn Ads reports, this guide shows you how to create unified cross-platform tables and insights that automatically update in Google Slides.
***
## What You'll Build
By the end of this guide, you'll have automated workflows that:
* **Combine platform data** into unified tables (Google Ads + Meta Ads in one table)
* **Aggregate cross-platform data** into a single view (e.g., total clicks, cost, ROAS)
* **Standardize metrics** across platforms (rename fields to match)
* **Update Google Slides** with consolidated performance data
***
## The Manual Problem We're Solving
Normally, creating cross-platform reports involves:
1. **Export data** from Google Ads, Meta Ads, LinkedIn Ads separately
2. **Manually rename columns** to match (e.g., "Link Clicks" vs "Clicks")
3. **Copy-paste into spreadsheets** and merge data
4. **Calculate totals and comparisons** manually
5. **Update slides** with new data each reporting period
6. **Repeat every week/month**
**This process takes hours and is error-prone.** We're going to automate all of it.
***
## Prerequisites
Before starting, ensure you have:
* **Google Slides presentation** ready for data
* **Connected ad accounts** (Google Ads, Meta Ads, LinkedIn Ads, etc.)
* **Basic workflow knowledge** (recommended: complete the [single-platform guide](/guides/automate-ads-reporting-to-slides) first)
***
## Method 1: Simple Merge (Same Column Names)
When your platforms return similar column names, you can merge data directly without renaming fields.
### Example: Google Ads + Meta Ads with Matching Columns
**Scenario:** You run campaigns on both Google Ads and Meta Ads and want to see all campaign performance in one table in your slides.
Both platforms return: `Campaign Name`, `Clicks`, `Impressions`, `Cost`
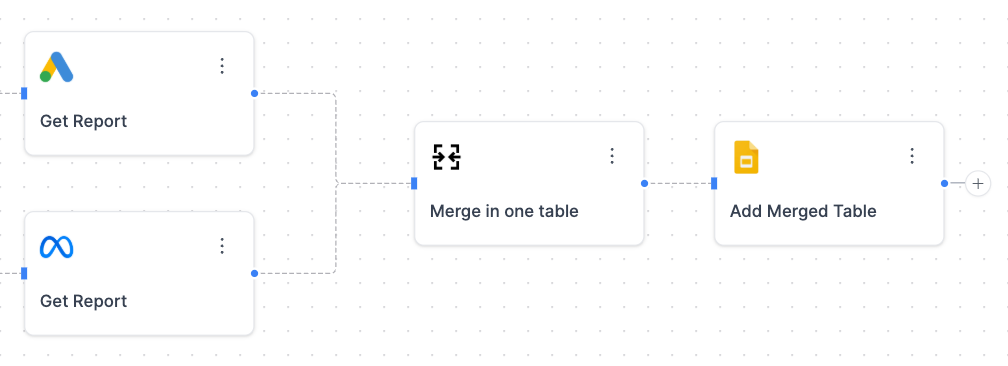
**Workflow Structure:**
```
Google Ads Get Report →
→ List Merge → Update Table
Meta Ads Get Report →
```
 ### Step 1: Get Data from Each Platform
**Add Google Ads Node:**
1. **Add Node** → **Google Ads** → **Get Report**
2. **Configure** your date range and metrics
3. **Select Metrics:** Clicks, Impressions, Cost
4. **Select Dimensions:** Data Source, Campaign Name
**Add Meta Ads Node:**
1. **Add Node** → **Meta Ads** → **Get Report**
2. **Configure** same date range
3. **Select Metrics:** Link Clicks, Impressions, Cost
4. **Select Dimensions:** Data Source, Campaign Name
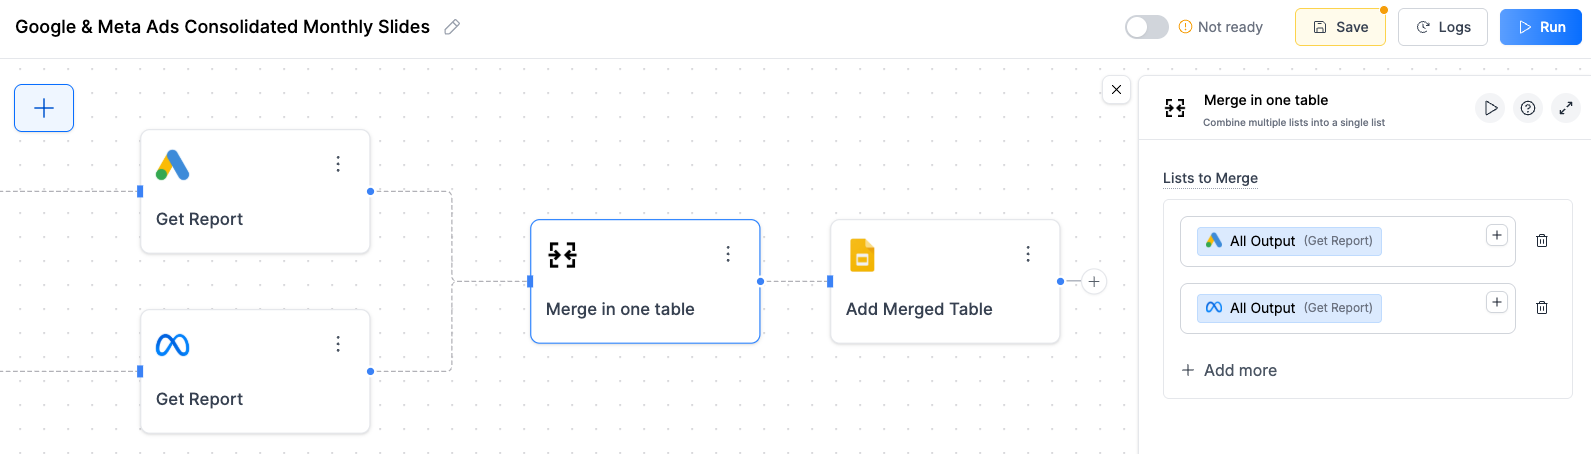
### Step 2: Merge the Data
**Add List Merge Node:**
1. **Add Node** → **List Tools** → **Merge**
2. **Connect** both ad platform outputs
3. **Configure:**
* **List 1:** Google Ads output
* **List 2:** Meta Ads output
### Step 1: Get Data from Each Platform
**Add Google Ads Node:**
1. **Add Node** → **Google Ads** → **Get Report**
2. **Configure** your date range and metrics
3. **Select Metrics:** Clicks, Impressions, Cost
4. **Select Dimensions:** Data Source, Campaign Name
**Add Meta Ads Node:**
1. **Add Node** → **Meta Ads** → **Get Report**
2. **Configure** same date range
3. **Select Metrics:** Link Clicks, Impressions, Cost
4. **Select Dimensions:** Data Source, Campaign Name
### Step 2: Merge the Data
**Add List Merge Node:**
1. **Add Node** → **List Tools** → **Merge**
2. **Connect** both ad platform outputs
3. **Configure:**
* **List 1:** Google Ads output
* **List 2:** Meta Ads output
 ### Step 3: Update Google Slides
**Prepare Your Slide:**
1. **Insert** → **Table** in Google Slides
2. **Right-click** → **Alt text** → Set to `cross_platform_table`
Not sure how to set alt text? Check out our previous guide on [getting started with Google Slides.](/guides/automate-ads-reporting-to-slides)
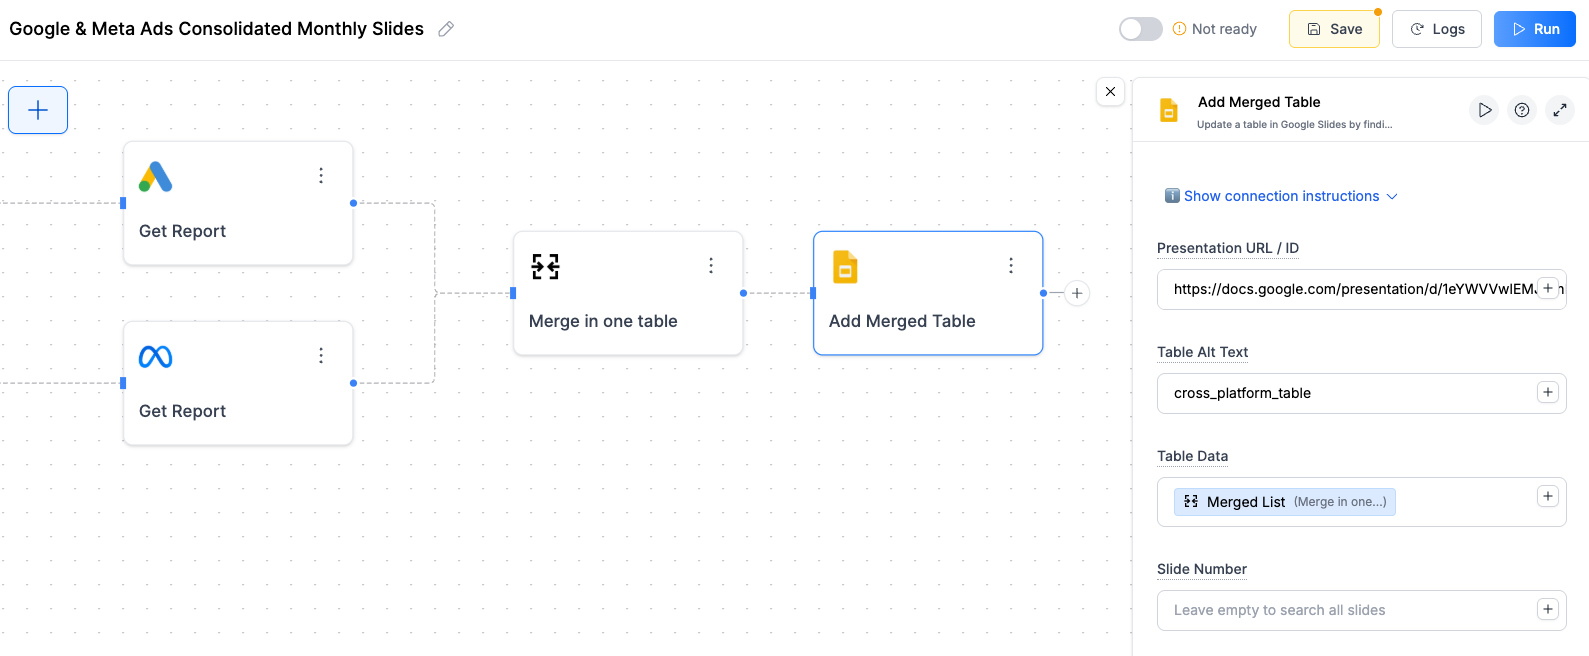
**Add Update Table Node:**
1. **Add Node** → **Google Slides** → **Update Table**
2. **Connect** to List Merge output
3. **Configure:**
* **Presentation URL:** Your slides URL
* **Table Alt Text:** `cross_platform_table`
* **Table Data:** Connect merged data
### Step 3: Update Google Slides
**Prepare Your Slide:**
1. **Insert** → **Table** in Google Slides
2. **Right-click** → **Alt text** → Set to `cross_platform_table`
Not sure how to set alt text? Check out our previous guide on [getting started with Google Slides.](/guides/automate-ads-reporting-to-slides)
**Add Update Table Node:**
1. **Add Node** → **Google Slides** → **Update Table**
2. **Connect** to List Merge output
3. **Configure:**
* **Presentation URL:** Your slides URL
* **Table Alt Text:** `cross_platform_table`
* **Table Data:** Connect merged data
 ***
## Method 2: Rename Fields + Merge (Different Column Names)
When platforms use different column names for the same metrics, we need to rename them first to ensure consistency. Otherwise, you will get a different field name for each platform, making it messy.
### Example: Standardizing Different Metric Names
**The Problem:** Each platform uses different names for the same thing.
* **Google Ads:** "Clicks" and "Conversions"
* **Meta Ads:** "Link Clicks" and "Purchases"
**The Solution:** Rename Meta Ads fields to match Google Ads so you get consistent column names.
### Step 1: Get Data from Each Platform
**Add Google Ads Node:**
1. **Add Node** → **Google Ads** → **Get Report**
2. **Configure** your date range
3. **Select Metrics:** Clicks, Cost, Conversions
4. **Select Dimensions:** Data Source, Campaign Name
**Add Meta Ads Node:**
1. **Add Node** → **Meta Ads** → **Get Report**
2. **Configure** same date range
3. **Select Metrics:** Link Clicks, Cost, Purchases
4. **Select Dimensions:** Data Source, Campaign Name
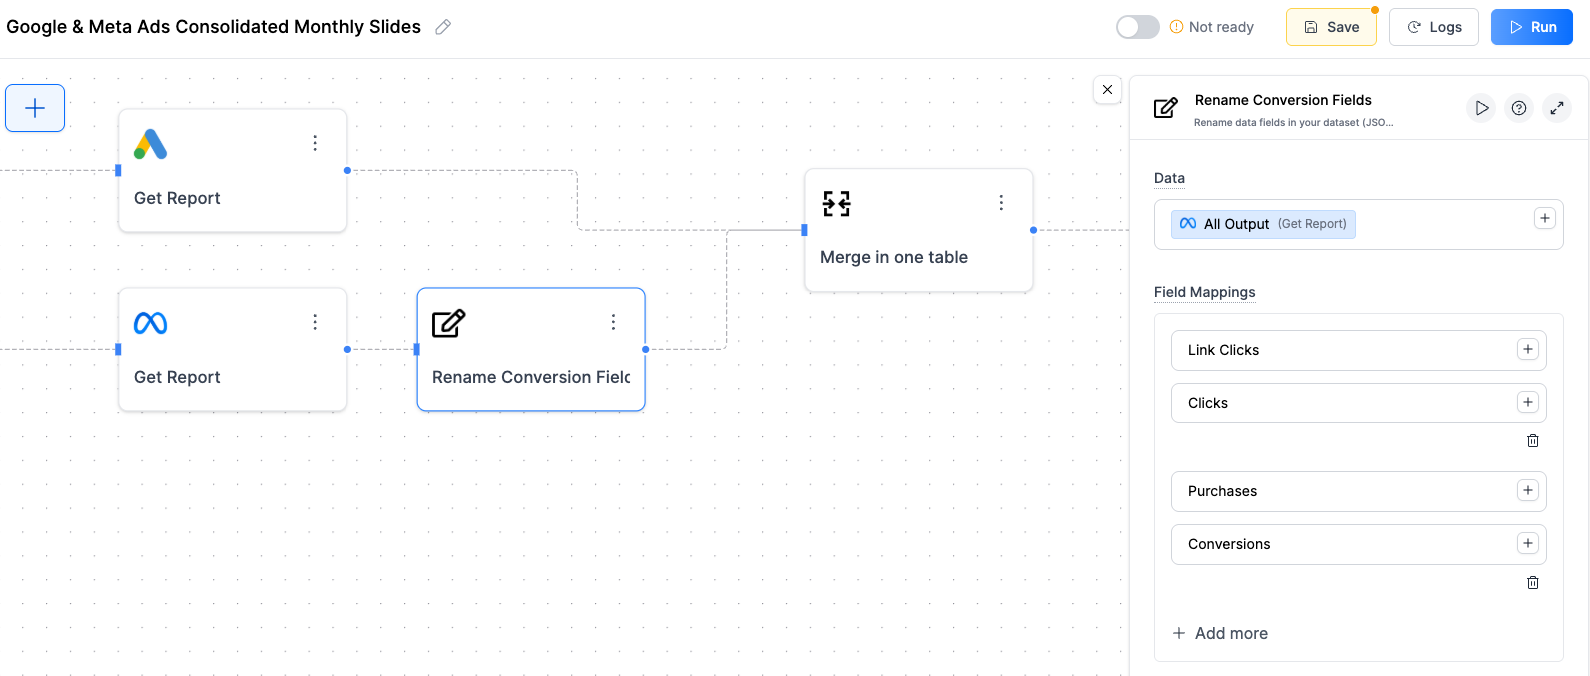
### Step 2: Rename Meta Ads Fields to Match Google Ads
**Rename Meta Ads Fields:**
1. **Add Node** → **Utilities** → **Rename Conversion Fields**
2. **Connect** to Meta Ads output
3. **Configure field mappings:**
* **Link Clicks** → **Clicks**
* **Purchases** → **Conversions**
*Note: Only rename the fields that differ. Cost, Campaign Name, and Data Source stay the same automatically.*
***
## Method 2: Rename Fields + Merge (Different Column Names)
When platforms use different column names for the same metrics, we need to rename them first to ensure consistency. Otherwise, you will get a different field name for each platform, making it messy.
### Example: Standardizing Different Metric Names
**The Problem:** Each platform uses different names for the same thing.
* **Google Ads:** "Clicks" and "Conversions"
* **Meta Ads:** "Link Clicks" and "Purchases"
**The Solution:** Rename Meta Ads fields to match Google Ads so you get consistent column names.
### Step 1: Get Data from Each Platform
**Add Google Ads Node:**
1. **Add Node** → **Google Ads** → **Get Report**
2. **Configure** your date range
3. **Select Metrics:** Clicks, Cost, Conversions
4. **Select Dimensions:** Data Source, Campaign Name
**Add Meta Ads Node:**
1. **Add Node** → **Meta Ads** → **Get Report**
2. **Configure** same date range
3. **Select Metrics:** Link Clicks, Cost, Purchases
4. **Select Dimensions:** Data Source, Campaign Name
### Step 2: Rename Meta Ads Fields to Match Google Ads
**Rename Meta Ads Fields:**
1. **Add Node** → **Utilities** → **Rename Conversion Fields**
2. **Connect** to Meta Ads output
3. **Configure field mappings:**
* **Link Clicks** → **Clicks**
* **Purchases** → **Conversions**
*Note: Only rename the fields that differ. Cost, Campaign Name, and Data Source stay the same automatically.*
 ### Step 3: Merge Standardized Data
**Add List Merge Node:**
1. **Add Node** → **List Tools** → **Merge**
2. **Connect** Google Ads output and renamed Meta Ads output
3. **Merge Type:** Combine
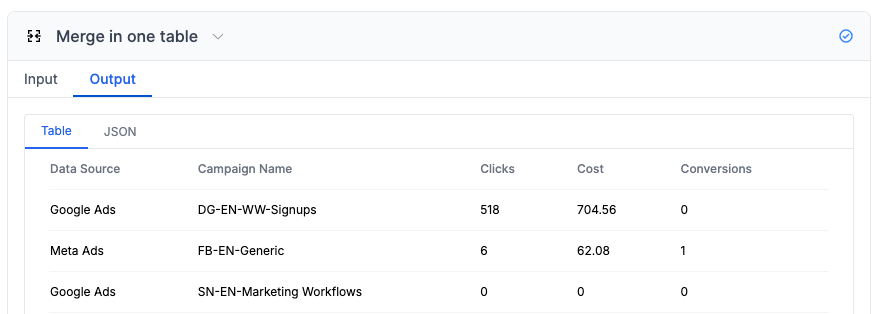
**Result:** Now both platforms have consistent column names: `Data Source`, `Campaign Name`, `Clicks`, `Conversions`, `Cost`
### Step 3: Merge Standardized Data
**Add List Merge Node:**
1. **Add Node** → **List Tools** → **Merge**
2. **Connect** Google Ads output and renamed Meta Ads output
3. **Merge Type:** Combine
**Result:** Now both platforms have consistent column names: `Data Source`, `Campaign Name`, `Clicks`, `Conversions`, `Cost`
 ***
## Method 3: AI Aggregation (Cross-Platform Totals)
Use AI to aggregate data across platforms and create summary insights with totals and comparisons.
### Example: Combined Performance Summary
**The Goal:** Instead of seeing individual campaign rows, create one summary showing your total advertising performance across all platforms.
Perfect for executive dashboards where you want to show:
* **Total advertising spend** across all channels
* **Total Scorecards** (clicks, conversions, ctr)
* **Ecommerce ROAS** (take revenue from Shopify and Cost from ads)
### Step 1: Collect Data
Pull data from each platform you want to include in your summary. The AI will handle standardizing field names automatically.
### Step 2: AI Aggregation
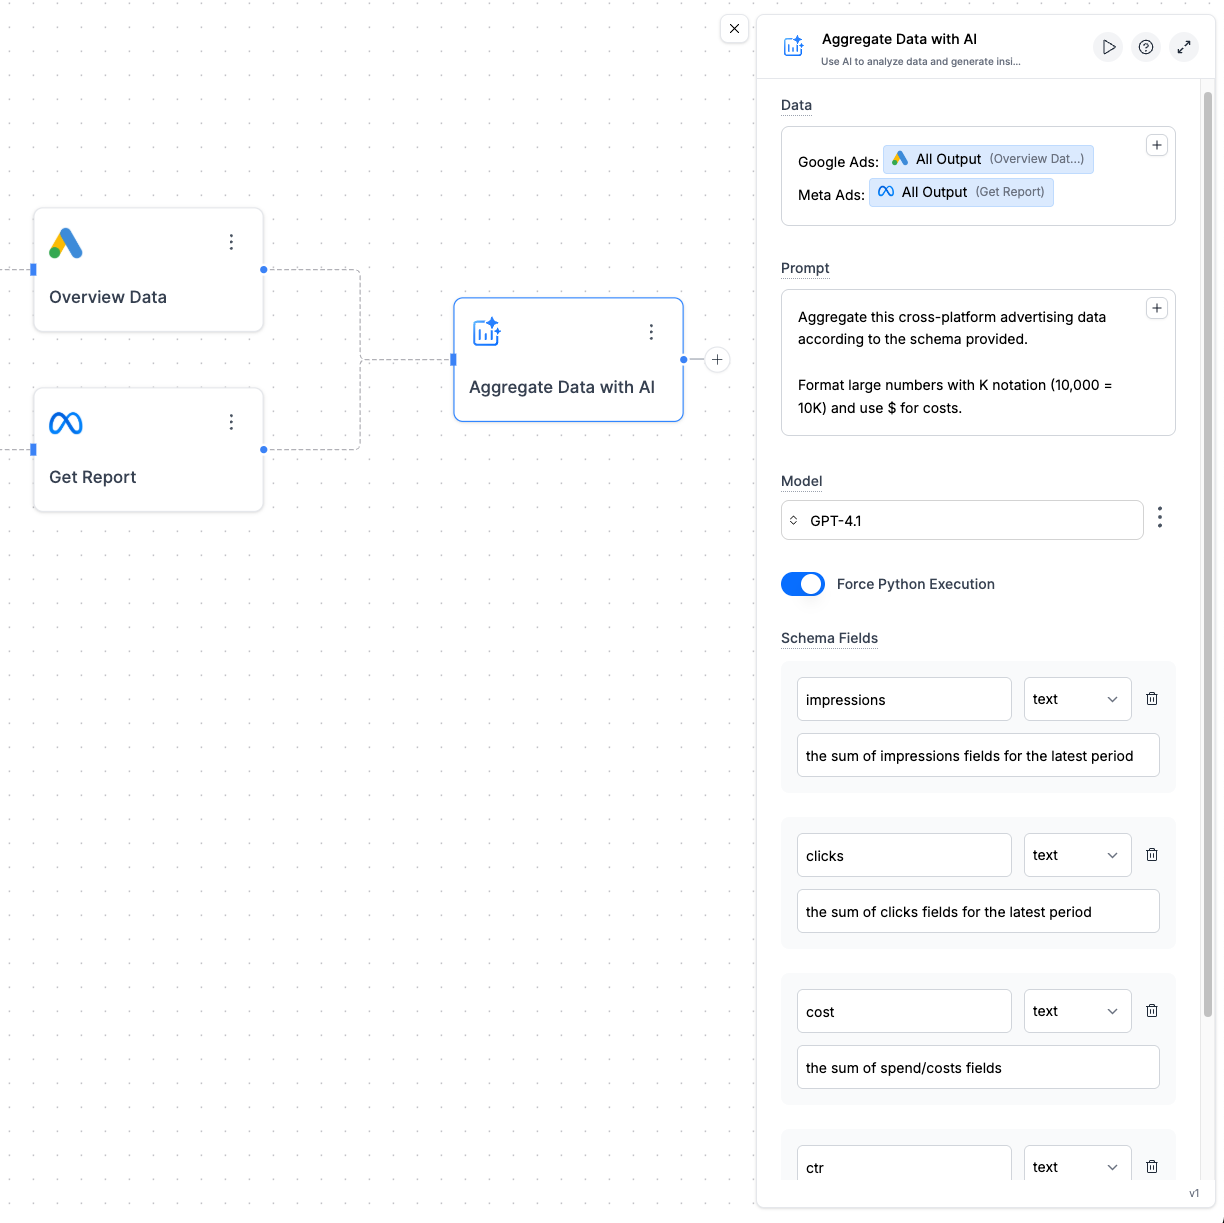
**Add AI Analyze Data Node:**
1. **Add Node** → **AI** → **Analyze Data**
2. **Connect** Google Ads and Meta Ads outputs
3. **Configure:**
**Data:**
* **Google Ads:** Connect Google Ads output
* **Meta Ads:** Connect Meta Ads output
**Prompt:**
```
Aggregate this cross-platform advertising data according to the schema provided.
Format large numbers with K notation (10,000 = 10K) and use $ for costs.
```
**Force Python Execution:** this will ensure the AI use code to do the calculations and avoid any hallucinations.
**Schema Fields:**
* `cost` (text) - "the sum of spend/costs fields"
* `clicks` (text) - "the sum of clicks fields"
* `impressions` (text) - "the sum of impressions fields"
* `conversions` (text) - "the sum of conversions fields"
* `ctr` (text) - "(the sum of clicks fields) divided by (the sum of impressions fields). Add % sign to the number"
***
## Method 3: AI Aggregation (Cross-Platform Totals)
Use AI to aggregate data across platforms and create summary insights with totals and comparisons.
### Example: Combined Performance Summary
**The Goal:** Instead of seeing individual campaign rows, create one summary showing your total advertising performance across all platforms.
Perfect for executive dashboards where you want to show:
* **Total advertising spend** across all channels
* **Total Scorecards** (clicks, conversions, ctr)
* **Ecommerce ROAS** (take revenue from Shopify and Cost from ads)
### Step 1: Collect Data
Pull data from each platform you want to include in your summary. The AI will handle standardizing field names automatically.
### Step 2: AI Aggregation
**Add AI Analyze Data Node:**
1. **Add Node** → **AI** → **Analyze Data**
2. **Connect** Google Ads and Meta Ads outputs
3. **Configure:**
**Data:**
* **Google Ads:** Connect Google Ads output
* **Meta Ads:** Connect Meta Ads output
**Prompt:**
```
Aggregate this cross-platform advertising data according to the schema provided.
Format large numbers with K notation (10,000 = 10K) and use $ for costs.
```
**Force Python Execution:** this will ensure the AI use code to do the calculations and avoid any hallucinations.
**Schema Fields:**
* `cost` (text) - "the sum of spend/costs fields"
* `clicks` (text) - "the sum of clicks fields"
* `impressions` (text) - "the sum of impressions fields"
* `conversions` (text) - "the sum of conversions fields"
* `ctr` (text) - "(the sum of clicks fields) divided by (the sum of impressions fields). Add % sign to the number"
 ### Step 3: Update Slides with Summary
**Create Summary Table:**
1. **Add Node** → **Google Slides** → **Update Table**
2. **Connect** to AI aggregation output
3. **Table Alt Text:** `platform_summary_table`
**Result:** A single row showing your total cross-platform performance:
| Cost | Clicks | Impressions | Conversions | CTR |
| ------ | ------ | ----------- | ----------- | ---- |
| \$4.3K | 2.15K | 83K | 77 | 2.6% |
This summary is perfect for executive dashboards or high-level performance reviews.
***
## Which Method Should You Use?
Choose the right approach based on what you want to show in your slides:
| **Method** | **Best For** | **Result** |
| ---------------------------- | ---------------------------------------- | --------------------------------------------------------- |
| **Method 1: Simple Merge** | Campaign-level analysis | One table with all campaigns from both platforms |
| **Method 2: Rename + Merge** | When platforms use different field names | Standardized table with consistent column names |
| **Method 3: AI Aggregation** | Executive summaries and totals | Single row with combined performance across all platforms |
***
## Troubleshooting
Common causes:
* **Field name mismatches** (check rename configuration)
* **Different date ranges** between platforms
* **Platform connection issues** (test individual nodes first)
* **Data format differences** (dates, currencies, numbers)
Issues to check:
* **Force Python Execution** is enabled
* **Data format consistency** between platforms
* **Prompt clarity** - be more specific about calculations
**Solution:** Simplify the prompt, test with sample data, and gradually add complexity.
Check these:
* **Alt text matches exactly** (case-sensitive)
* **Table size** can accommodate all platform data
* **Data structure** - ensure merged data is properly formatted
* **Connection order** - make sure data flows correctly through merge node
**Solution:** Test with single platform first, then add merge step.
When platforms measure things differently:
* **Map similar metrics** (Link Clicks → Clicks)
* **Document differences** in your presentation
* **Use AI to explain** metric differences in insights
* **Consider separate sections** for platform-specific metrics
**Solution:** Focus on comparable metrics only, or create separate analysis for platform-specific insights.
### Step 3: Update Slides with Summary
**Create Summary Table:**
1. **Add Node** → **Google Slides** → **Update Table**
2. **Connect** to AI aggregation output
3. **Table Alt Text:** `platform_summary_table`
**Result:** A single row showing your total cross-platform performance:
| Cost | Clicks | Impressions | Conversions | CTR |
| ------ | ------ | ----------- | ----------- | ---- |
| \$4.3K | 2.15K | 83K | 77 | 2.6% |
This summary is perfect for executive dashboards or high-level performance reviews.
***
## Which Method Should You Use?
Choose the right approach based on what you want to show in your slides:
| **Method** | **Best For** | **Result** |
| ---------------------------- | ---------------------------------------- | --------------------------------------------------------- |
| **Method 1: Simple Merge** | Campaign-level analysis | One table with all campaigns from both platforms |
| **Method 2: Rename + Merge** | When platforms use different field names | Standardized table with consistent column names |
| **Method 3: AI Aggregation** | Executive summaries and totals | Single row with combined performance across all platforms |
***
## Troubleshooting
Common causes:
* **Field name mismatches** (check rename configuration)
* **Different date ranges** between platforms
* **Platform connection issues** (test individual nodes first)
* **Data format differences** (dates, currencies, numbers)
Issues to check:
* **Force Python Execution** is enabled
* **Data format consistency** between platforms
* **Prompt clarity** - be more specific about calculations
**Solution:** Simplify the prompt, test with sample data, and gradually add complexity.
Check these:
* **Alt text matches exactly** (case-sensitive)
* **Table size** can accommodate all platform data
* **Data structure** - ensure merged data is properly formatted
* **Connection order** - make sure data flows correctly through merge node
**Solution:** Test with single platform first, then add merge step.
When platforms measure things differently:
* **Map similar metrics** (Link Clicks → Clicks)
* **Document differences** in your presentation
* **Use AI to explain** metric differences in insights
* **Consider separate sections** for platform-specific metrics
**Solution:** Focus on comparable metrics only, or create separate analysis for platform-specific insights.