- Data Tables - Campaign performance tables
- Scorecards - Key metrics and KPIs
- Charts - Visual trends and comparisons
- Text Updates - AI-generated insights and summaries
Video Tutorial
Watch this step-by-step video guide to see the automation in action:Report Elements Overview
Most marketing reports contain these elements:| Element | What It Shows | Example |
|---|---|---|
| Data Table | Raw performance data | Campaign names, clicks, cost, conversions |
| Chart | Visual trends | Monthly spend trend, campaign comparison |
| Text Summary | Written insights | ”Brand campaigns had 25% higher CTR this month” |
| Scorecard | Key metrics | Total spend: $12,500, Total conversions: 145 |
Creating Data Tables
Most marketing reports start with a data table showing campaign performance, website metrics, or ad results. Instead of manually copying and pasting this data every week, let’s automate it.The Manual Process (What We’re Replacing)
Normally, to create a data table in Google Slides, you would:- Create a table in Google Slides
- Style it with colors, fonts, and formatting
- Go to Google Ads (or your data source)
- Export or copy the performance data
- Paste it into your table
- Repeat this every week/month
Overview of Steps
Here’s what we’ll build:- Create a styled table in Google Slides (one-time setup)
- Add “alt text” to identify the table (one-time setup)
- Build a workflow that pulls fresh data and updates the table
- Schedule it to run automatically
What’s Alt Text?
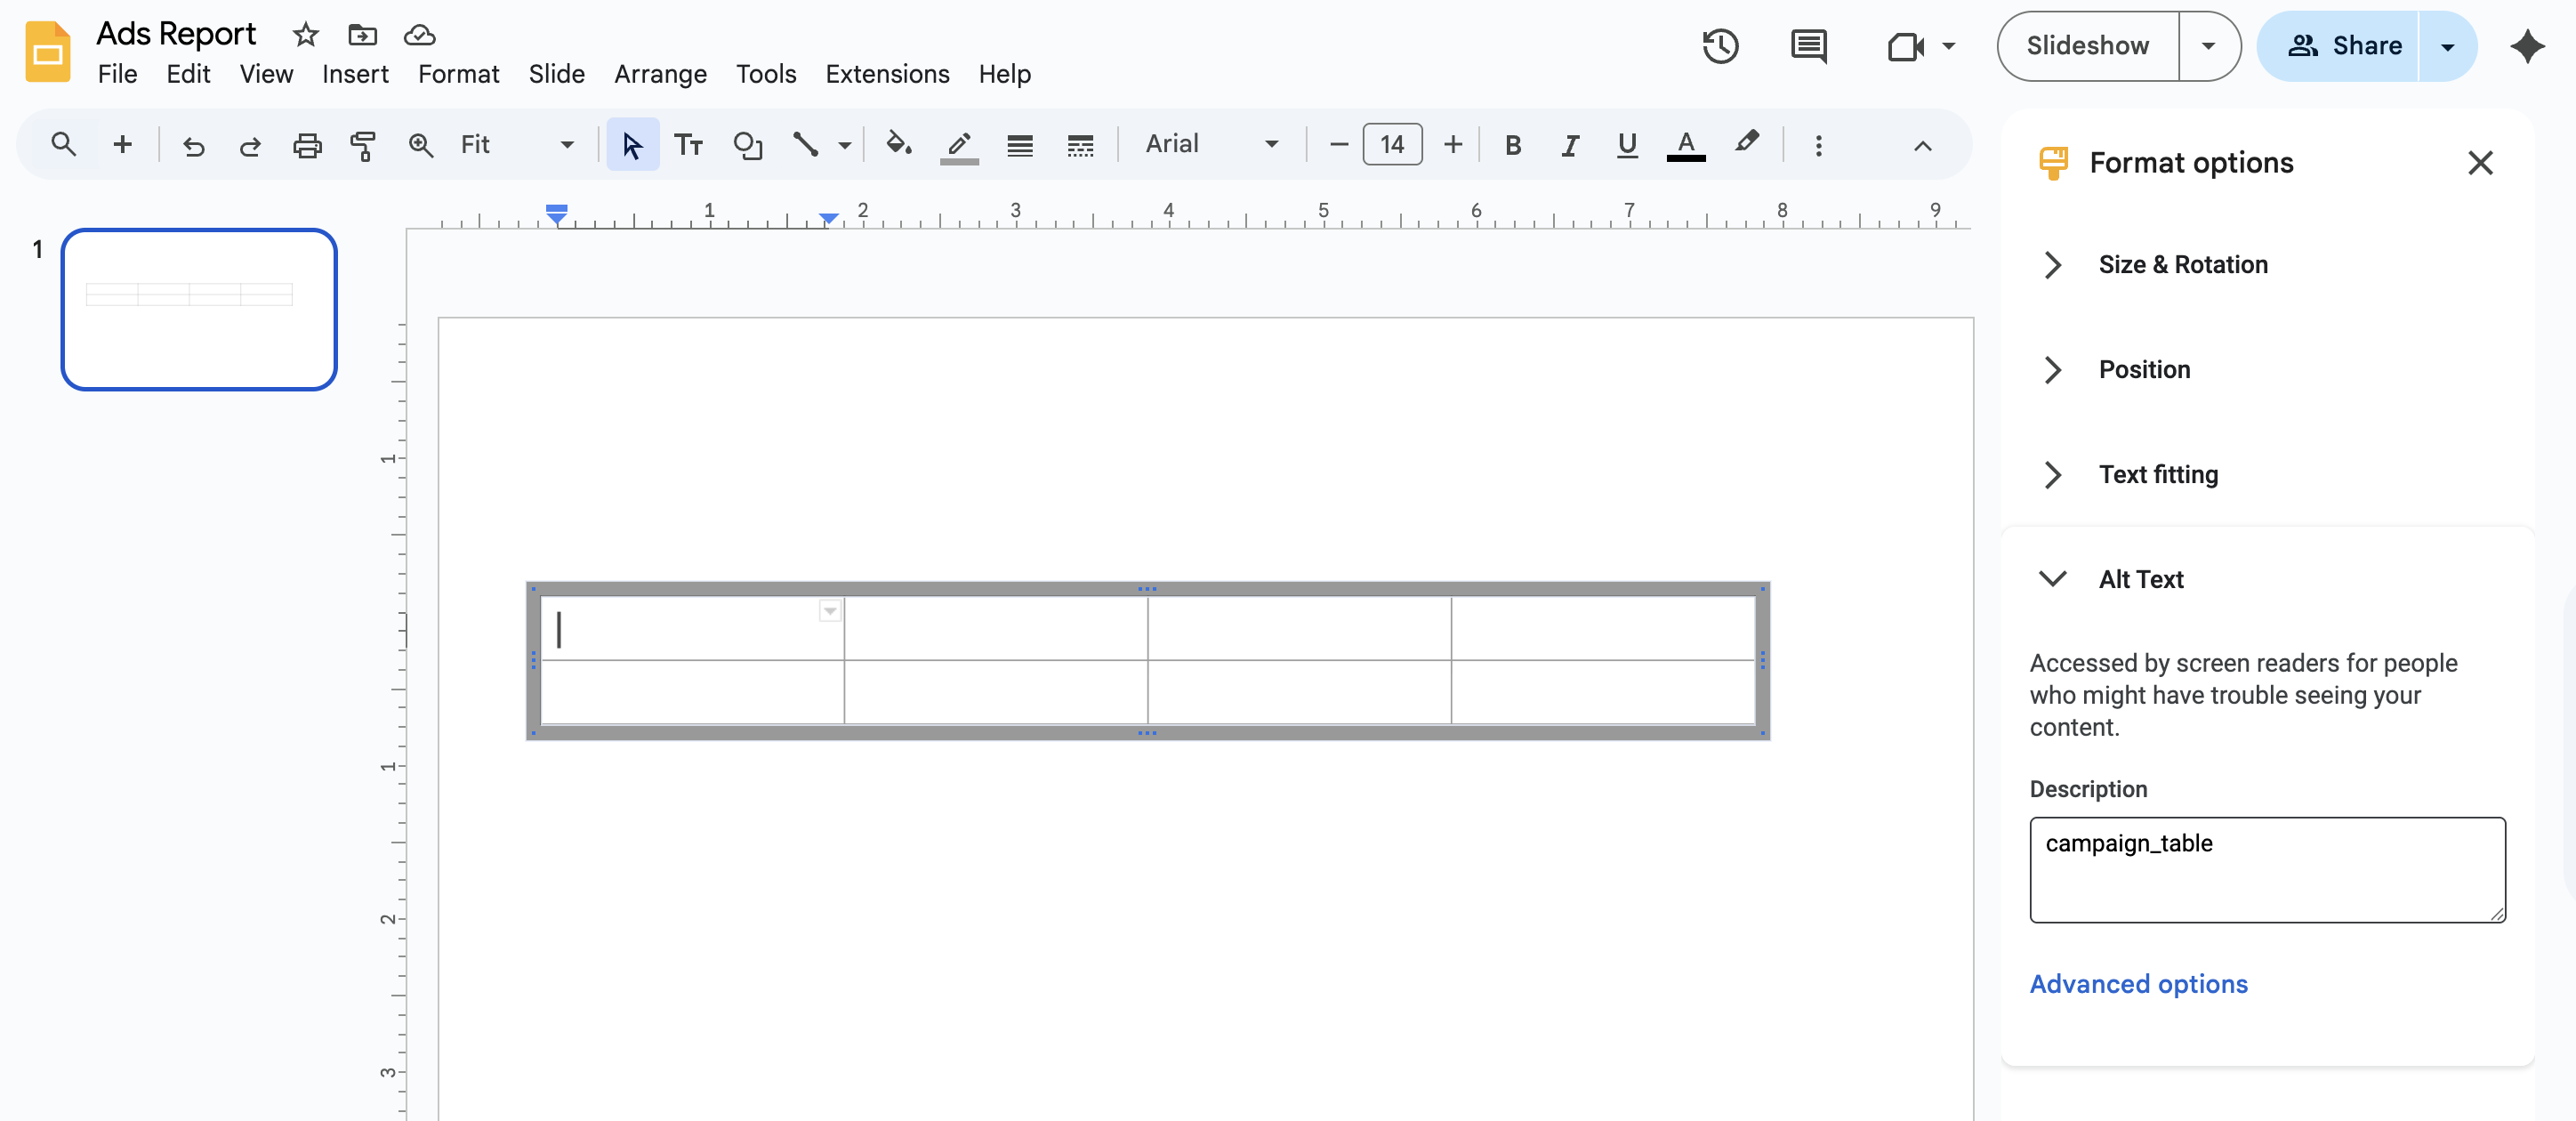
Alt text is normally used for accessibility (describing images to screen readers), but we use it as a unique identifier to tell Markifact which table to update. You’ll hear about alt text a lot in this guide - it’s the cornerstone of all our updates. Every element we want to automate (tables, charts, text) needs alt text so Markifact knows what to update.Step 1: Create Your Table in Google Slides
- Open Google Slides and create a new presentation
- Insert → Table → Choose any size (it will auto-adjust)
- Style your table: Add colors, fonts, borders - whatever you like
- Right-click the table → Alt text → Set to
campaign_table
Step 2: Build the Workflow in Markifact
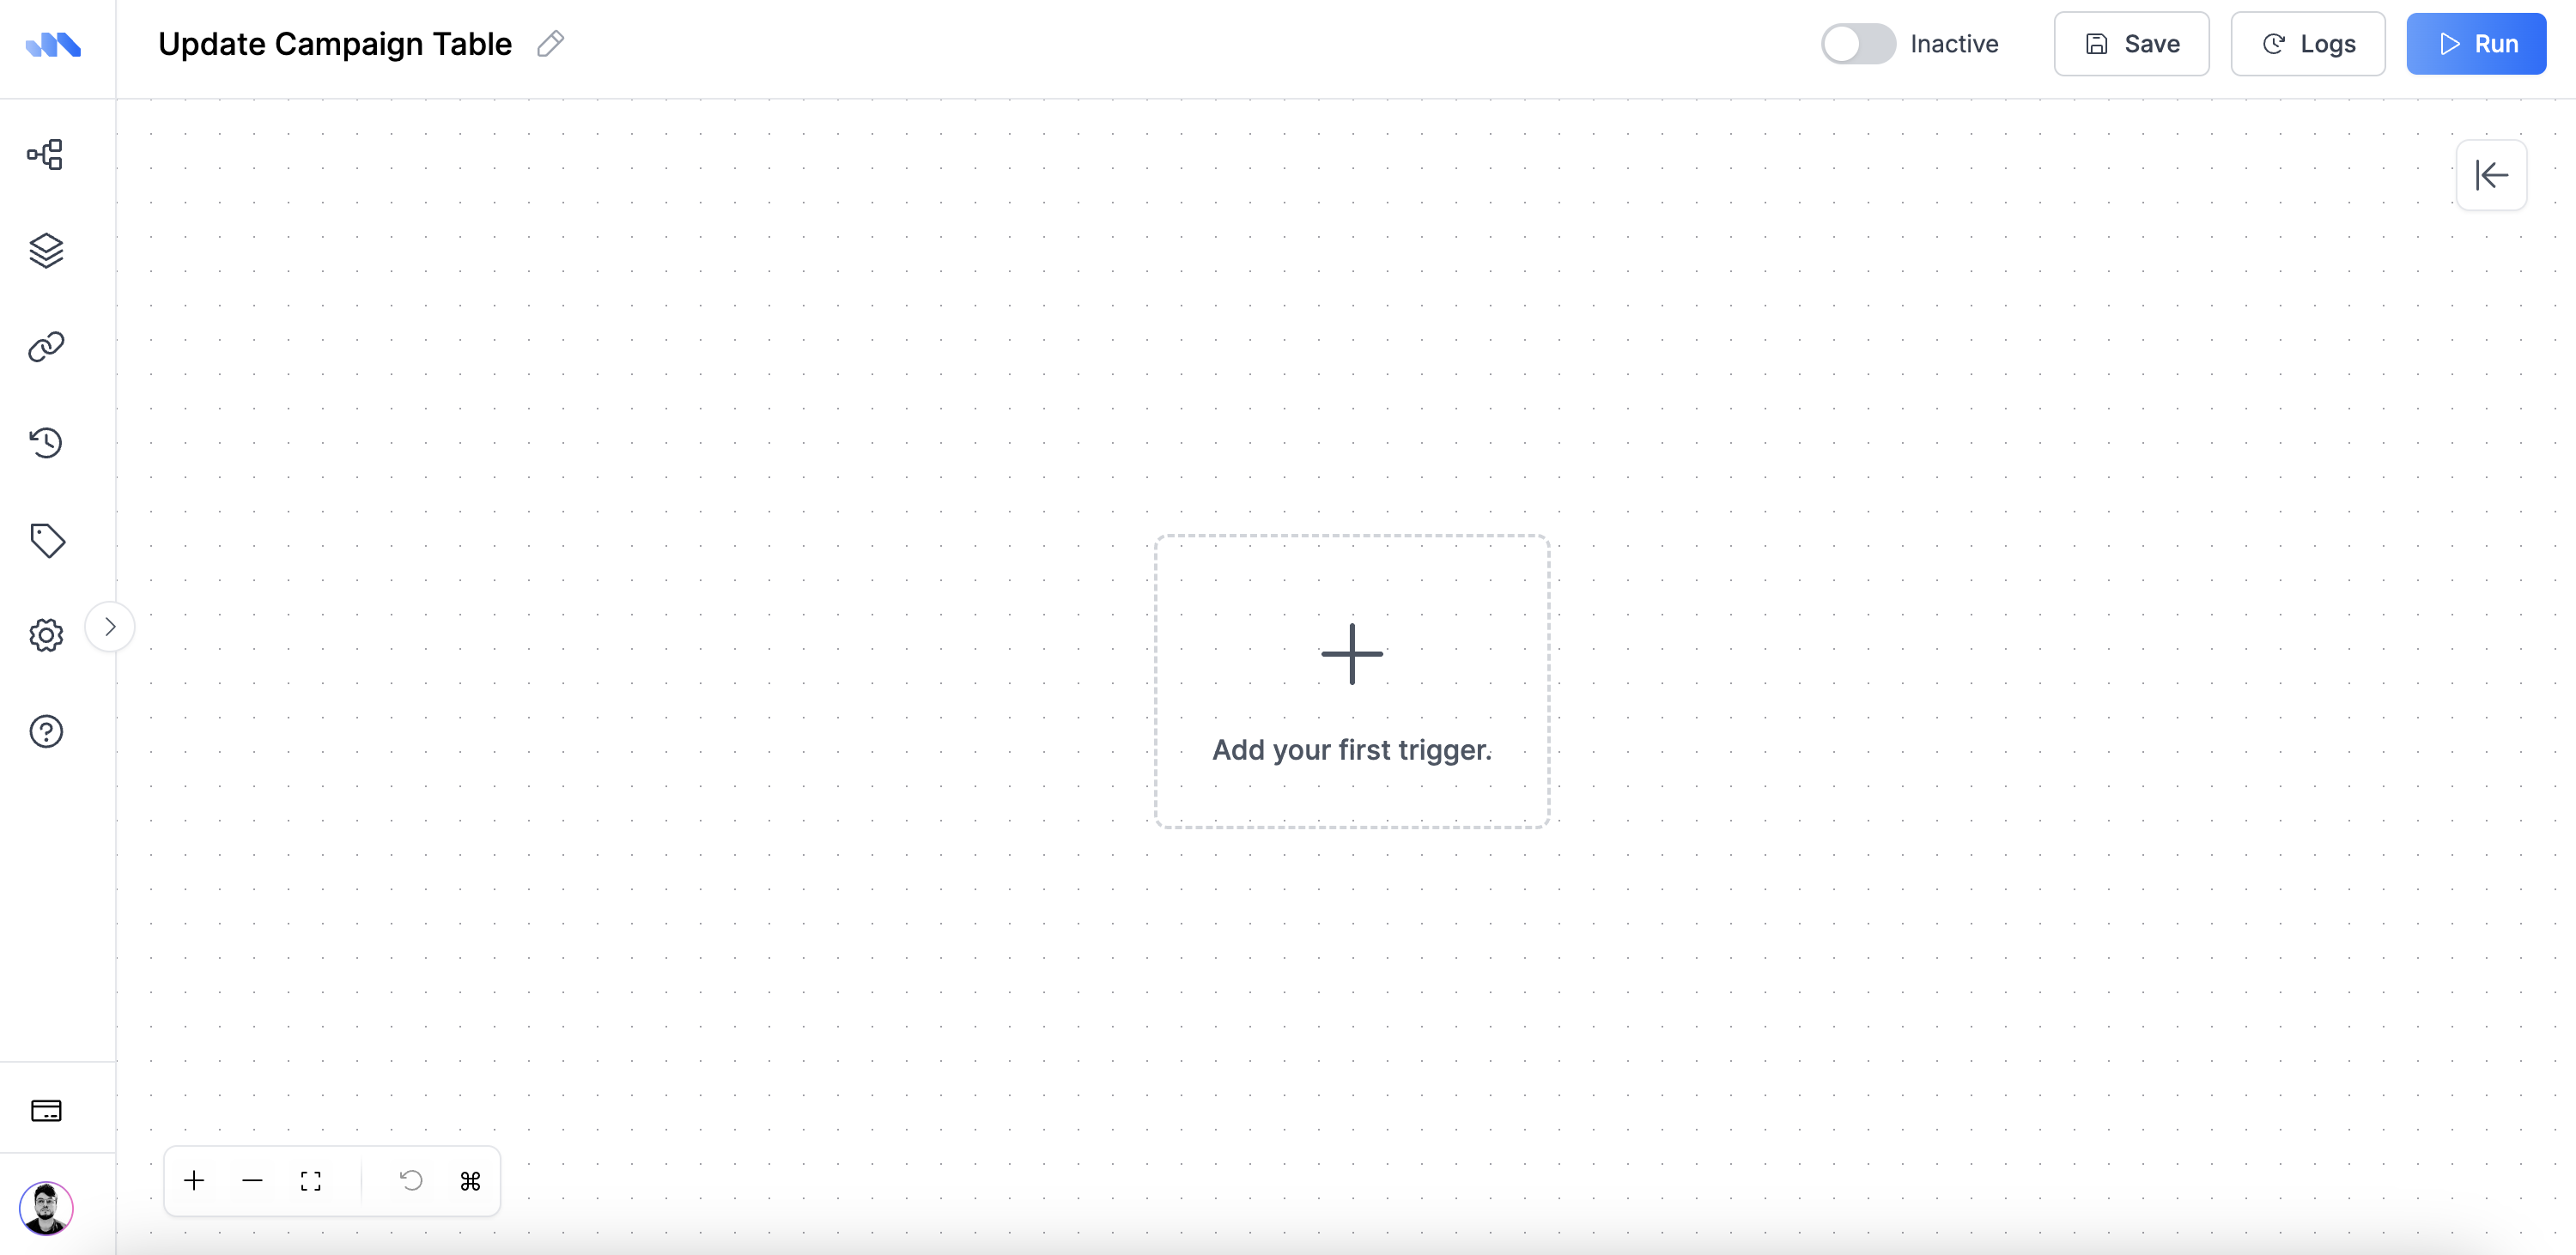
Now let’s create the automation that will update your table.Create the Workflow
- Go to Workflows in Markifact
- Click ”+ New Workflow”
- Name it:
Update Campaign Table
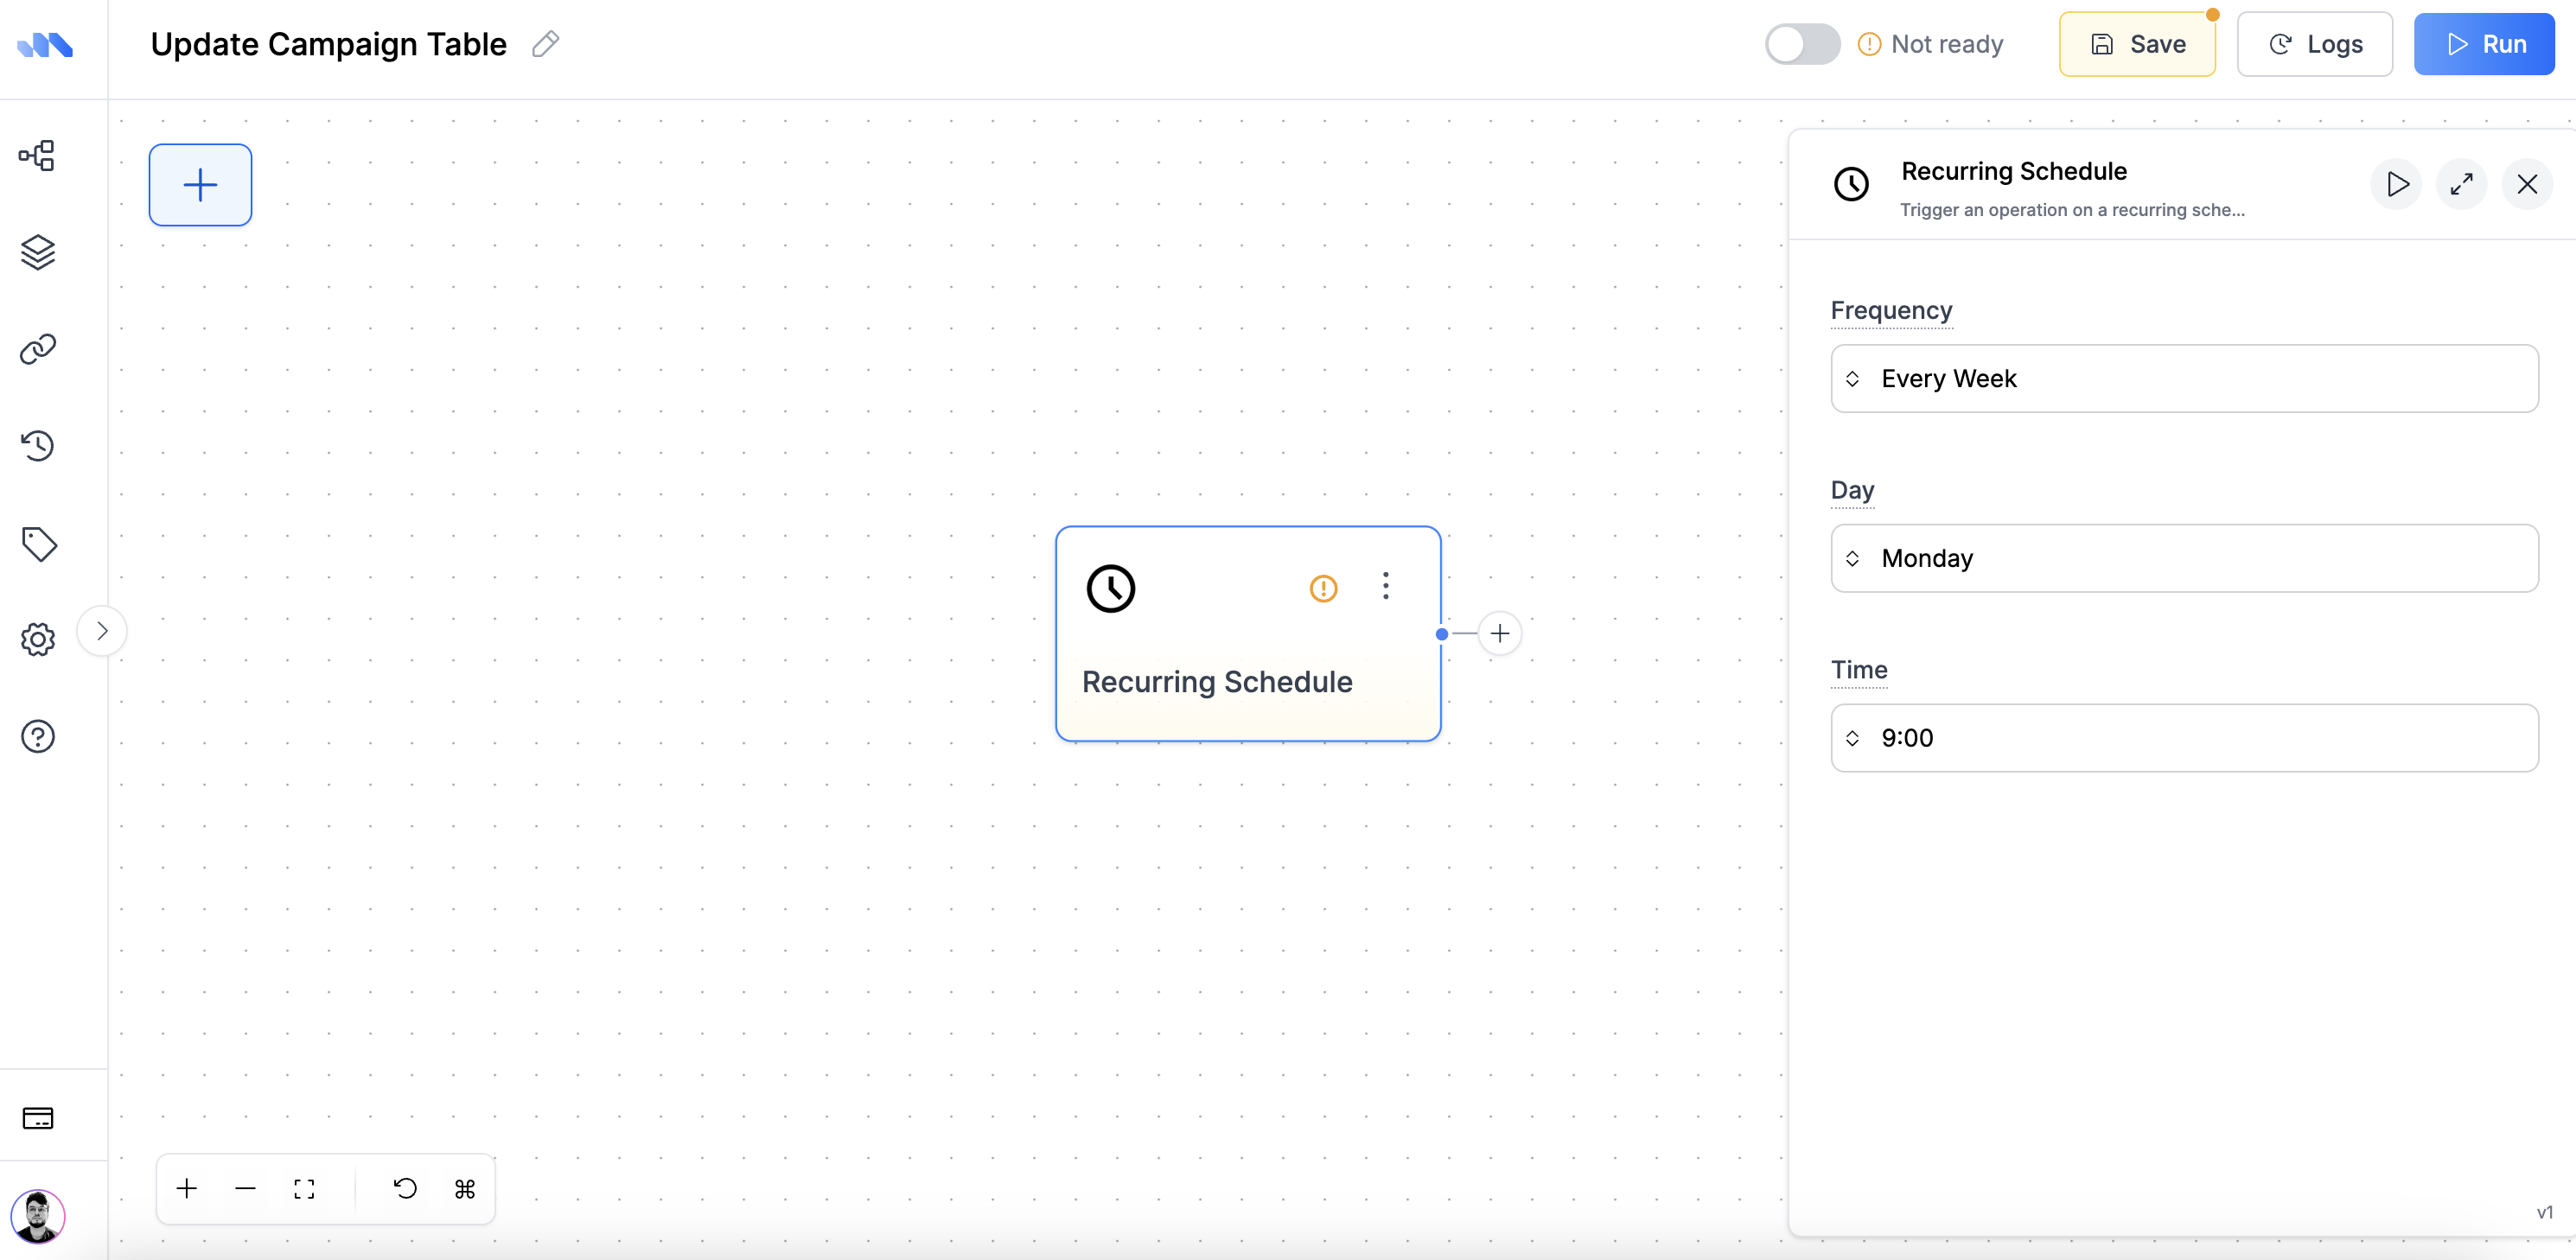
Add a Scheduler
If you want this to run automatically:- Add Node → Scheduler
- Set it up:
- Frequency: Weekly
- Day: Monday
- Time: 9:00 AM
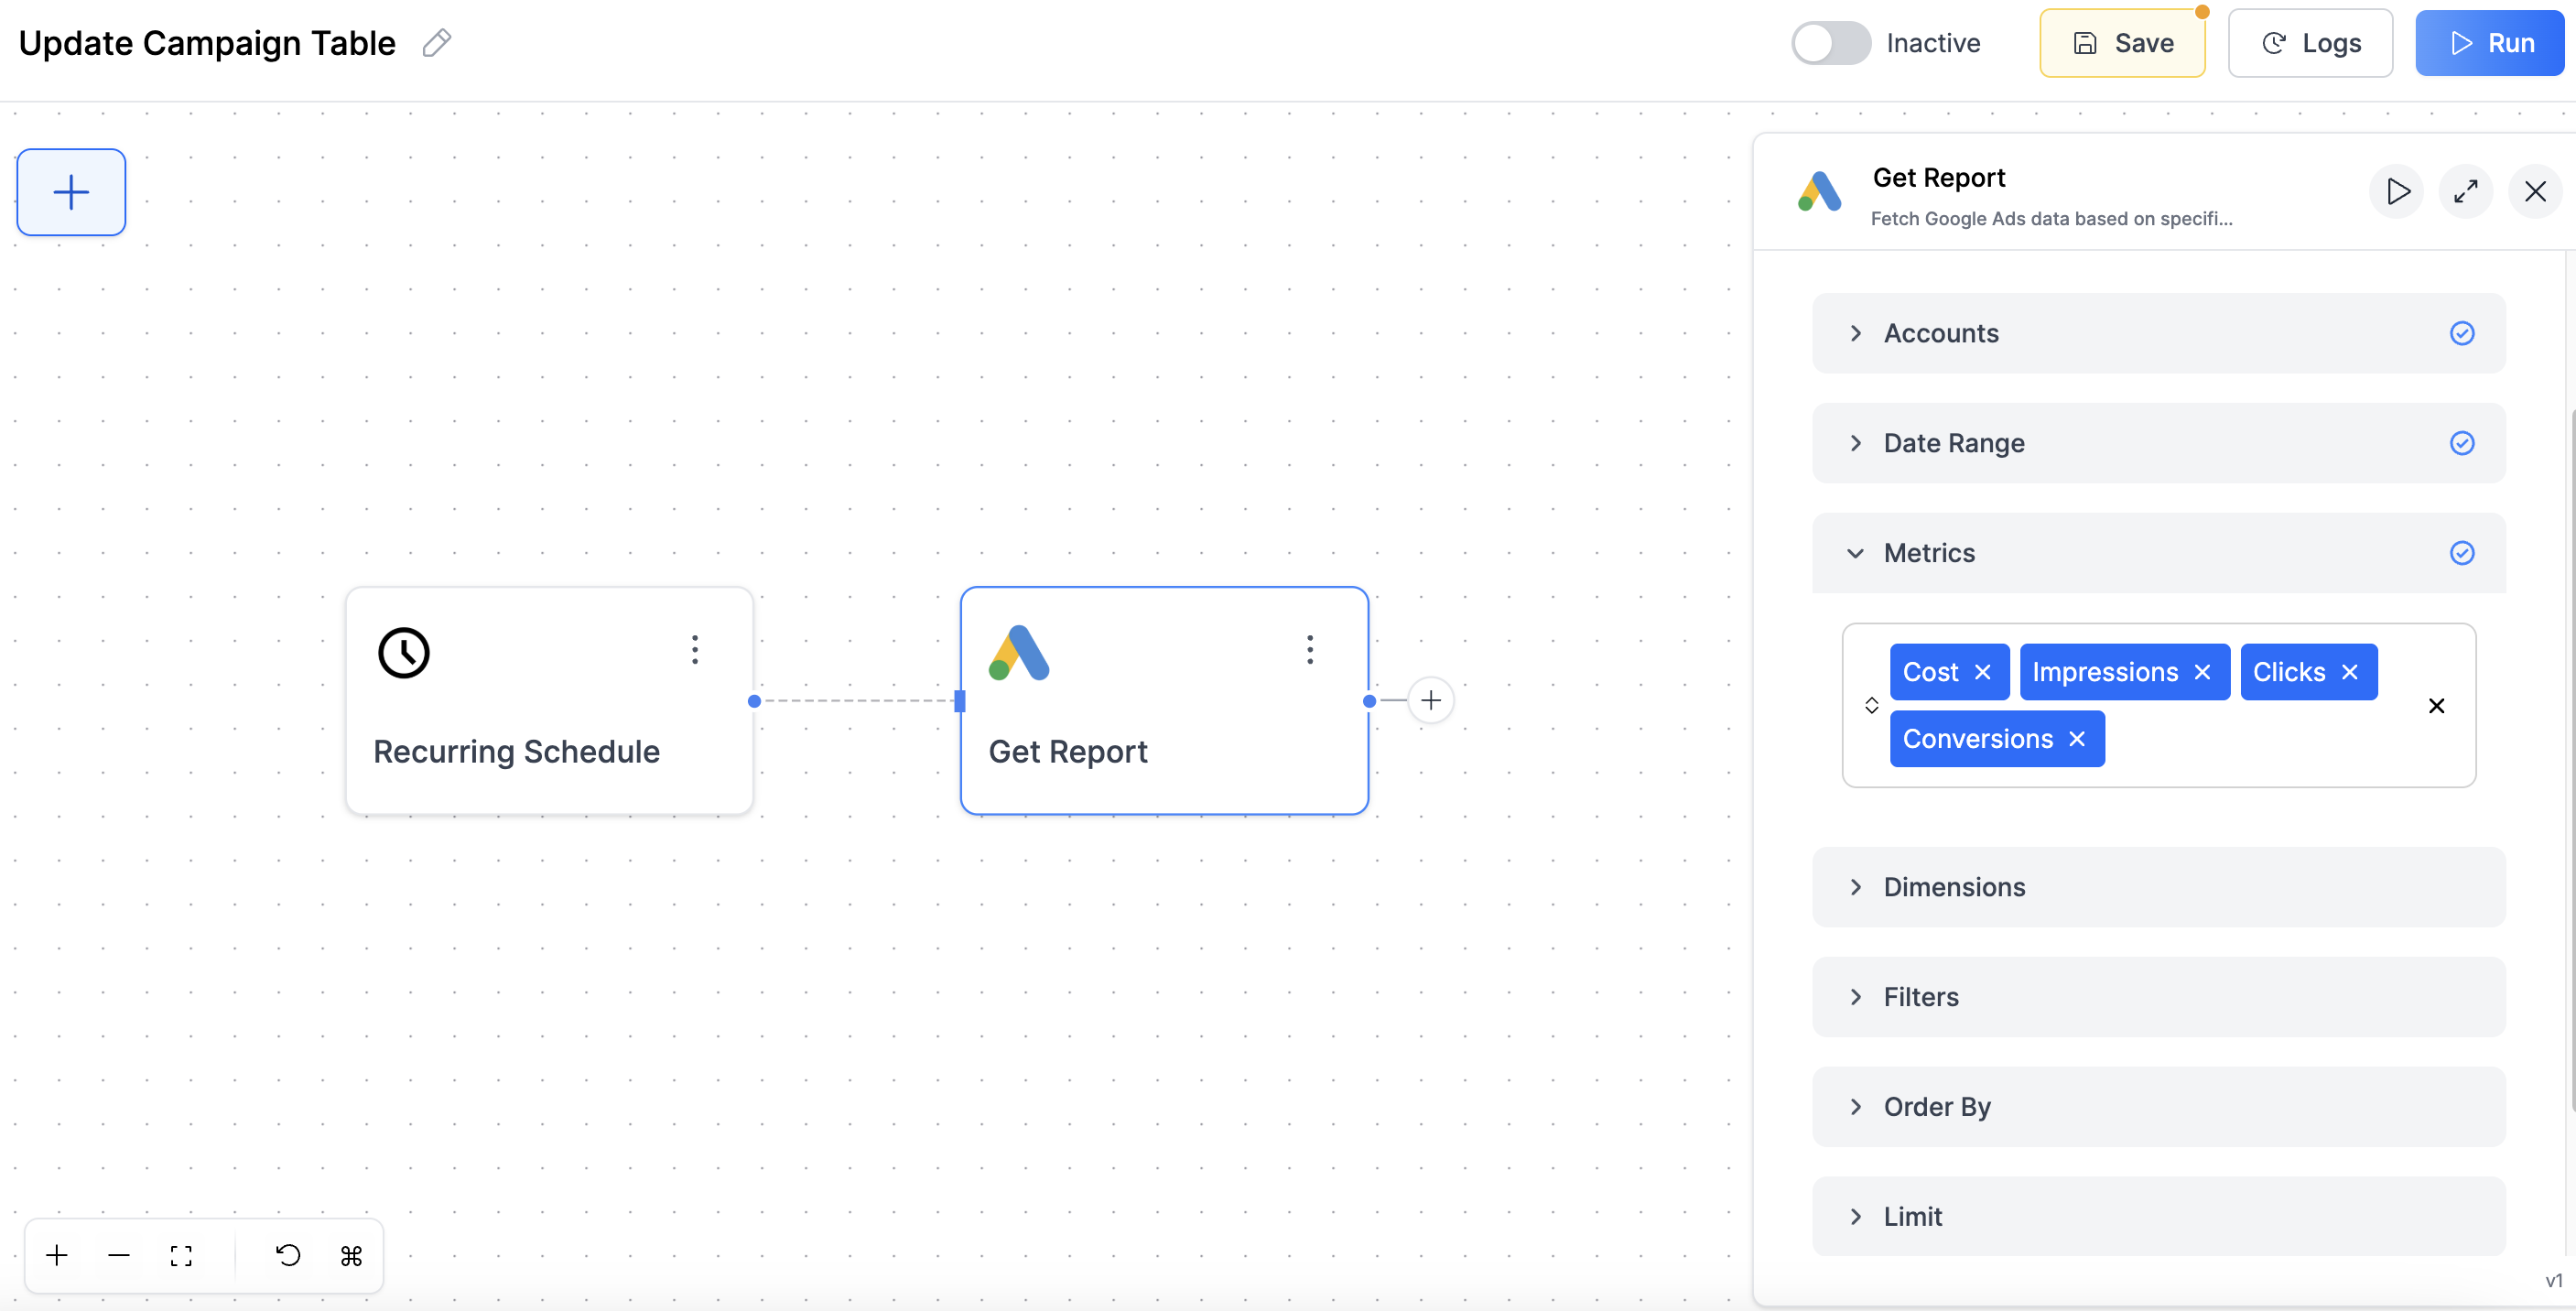
Add Google Ads Data
- Add Node → Google Ads → Get Report
- Connect it to your Scheduler (or skip scheduler for manual runs)
- Configure your data:
- Accounts: Select your Google Ads account
- Date Range: Last week (or your preferred period)
- Metrics: Choose what you want to see:
- Cost
- Impressions
- Clicks
- Conversions
- Dimensions: Campaign name
- Options:
- Pretty Column Names (makes headers readable)
- Display Currency Symbol (shows $ for cost)
- Compact Numbers (shows 10K instead of 10,000)
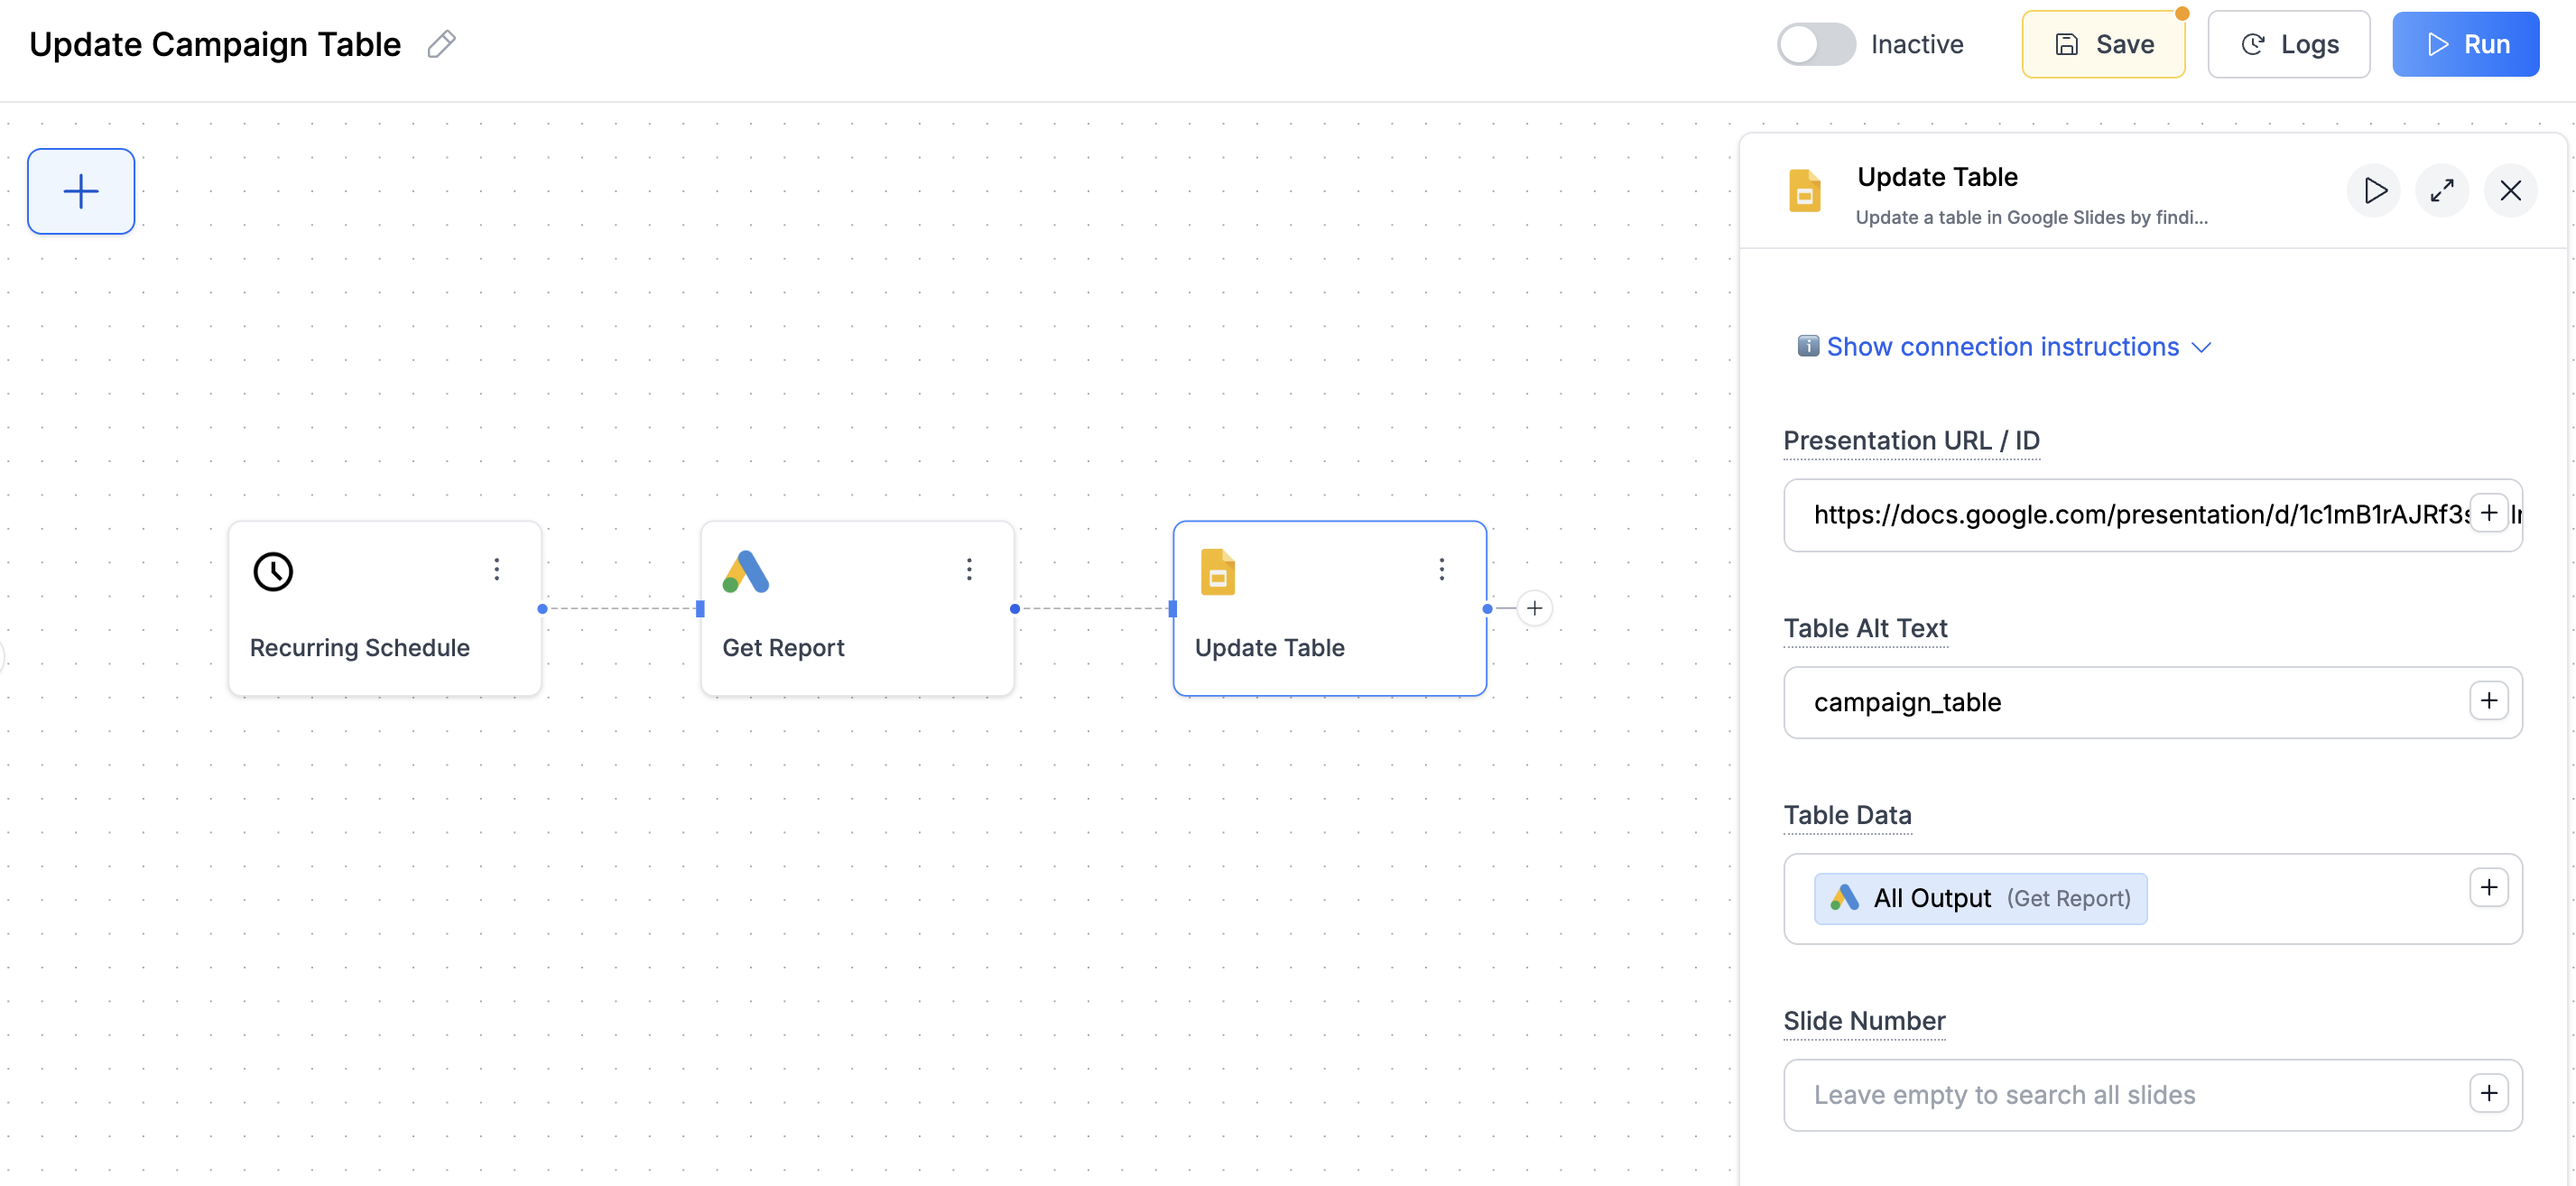
Update Your Google Slides Table
- Add Node → Google Slides → Update Table
- Connect it to your Google Ads node
- Configure:
- Presentation URL: Copy/paste your Google Slides URL
- Table Alt Text:
campaign_table(must match what you set earlier) - Table Data: Connect the output from your Google Ads node
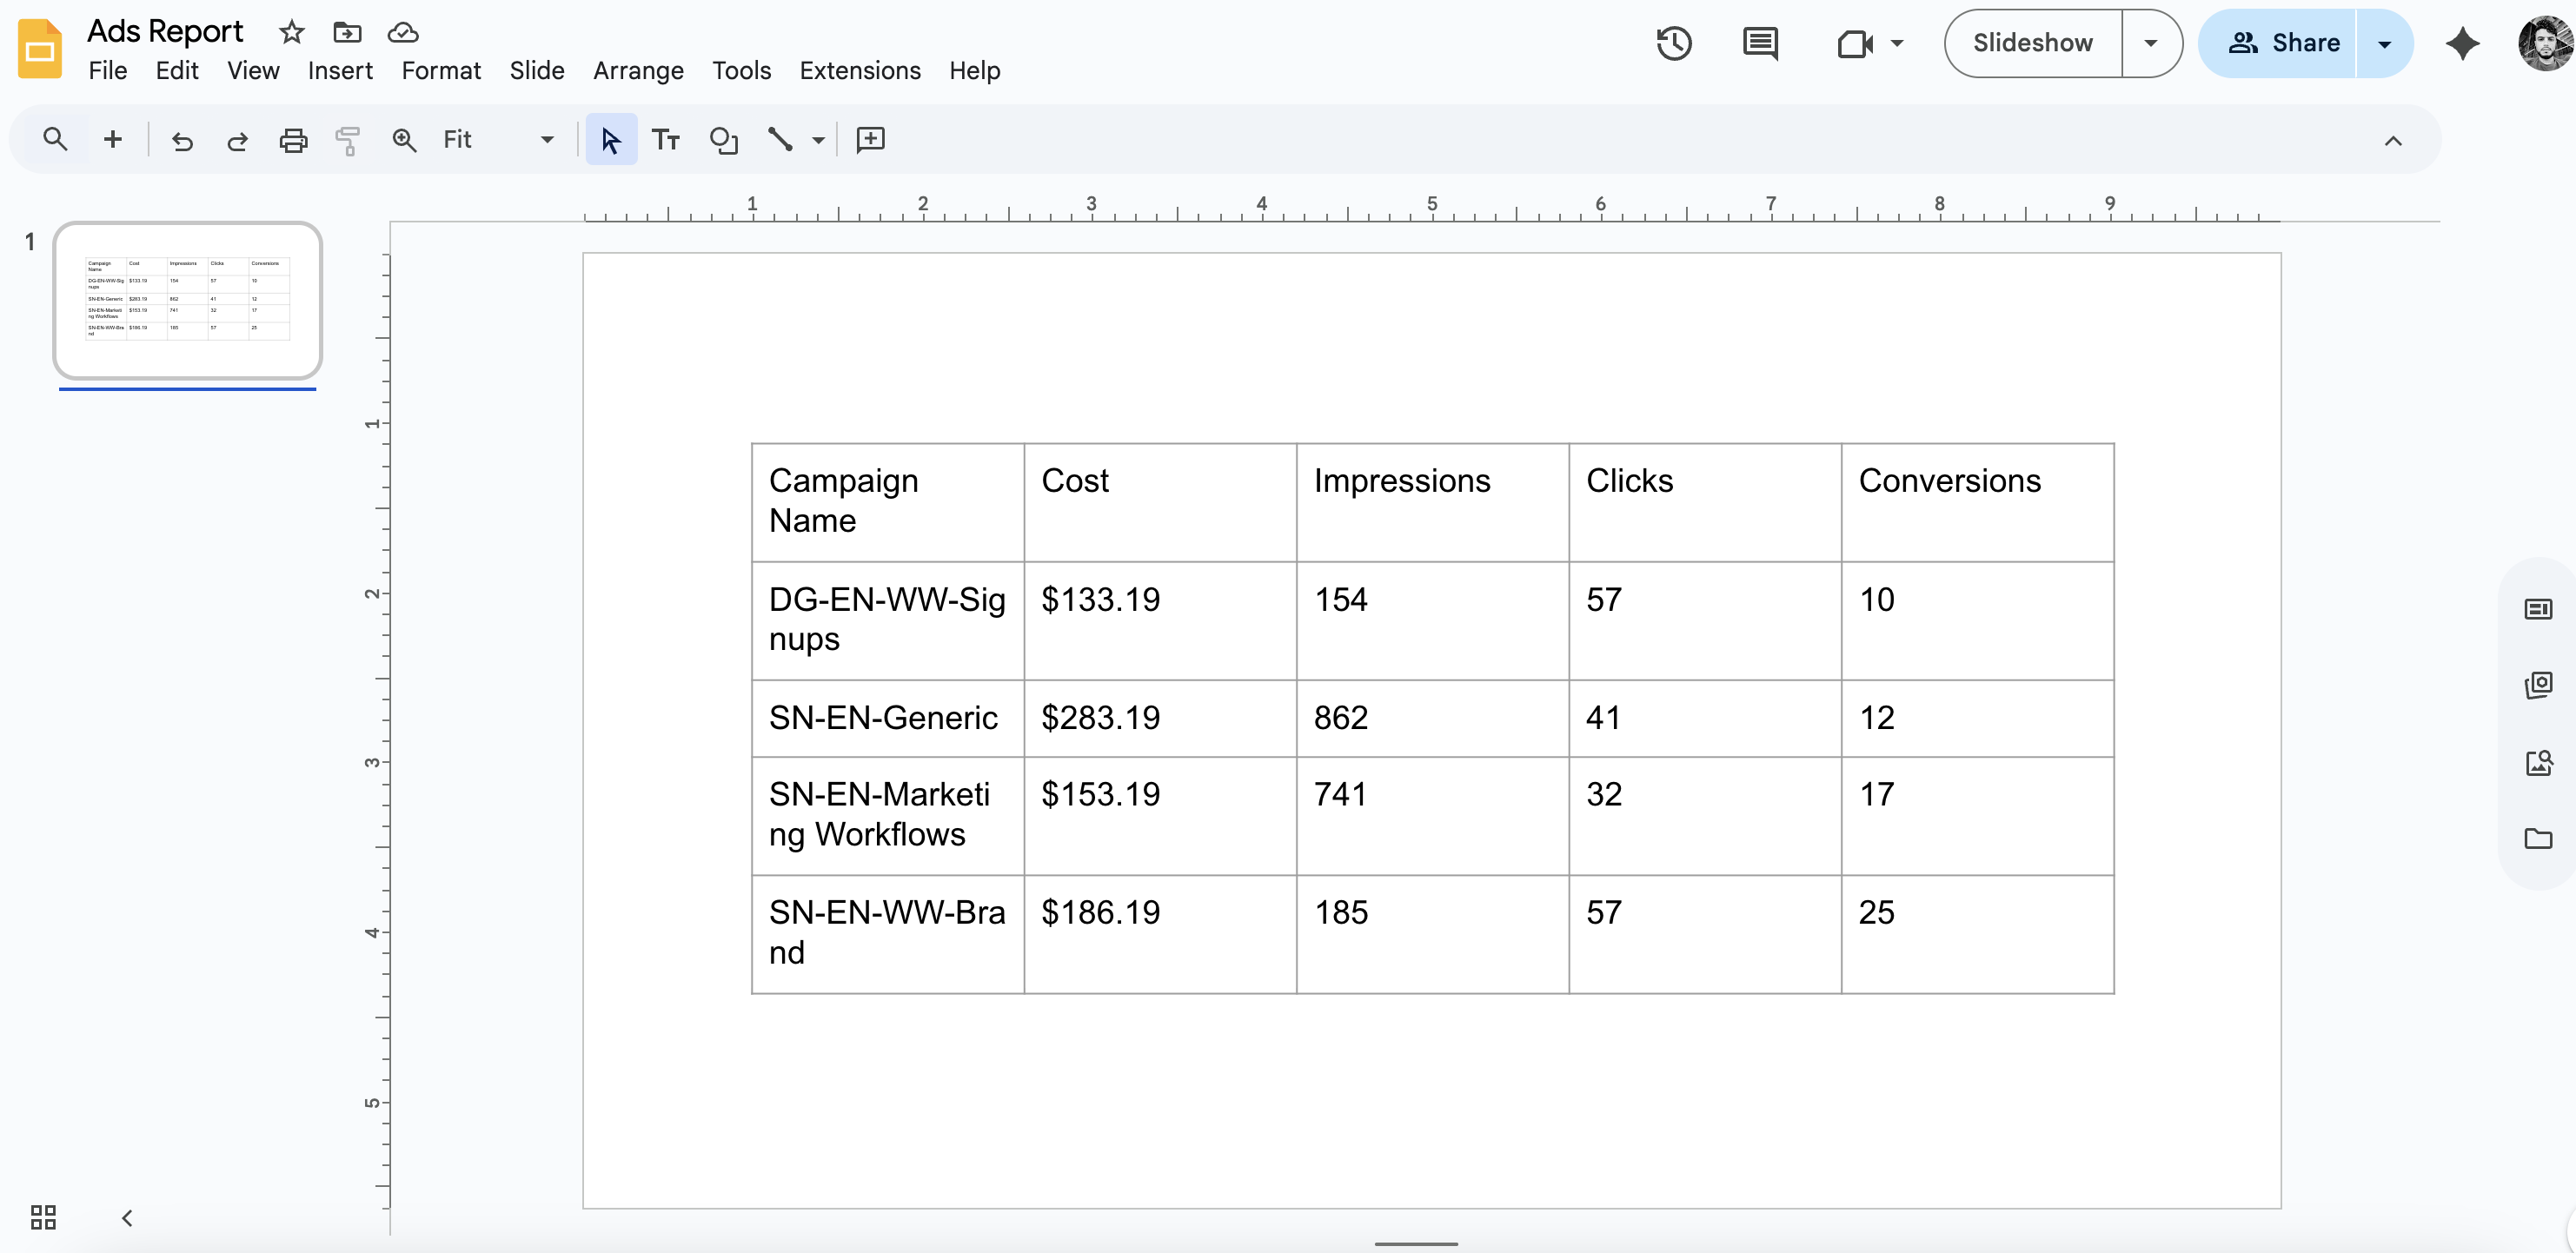
Step 3: Test It
- Click “Run” button in the top right of Markifact
- Go to your Google Slides and check your table
- Your table now shows fresh Google Ads data with proper headers and formatting
What Just Happened?
- Markifact found your table using the alt text
campaign_table - Pulled fresh Google Ads data and automatically created headers (Campaign Name, Cost, Clicks, etc.)
- Sized the table to fit your data perfectly
- Preserved your styling (colors, fonts, borders)
- Formatted the data with currency symbols and readable numbers
Creating Scorecards
Key metrics displayed prominently - total spend, conversions, etc. This is much simpler than tables because we can use the metric names directly.The Manual Process (What We’re Replacing)
Normally, to create scorecards in your reports, you would:- Go to Google Ads and look up total spend, total clicks, etc.
- Copy these numbers manually
- Format them properly ($12,450, 2.4%, etc.)
- Type these numbers into text boxes in your slides
- Repeat this every reporting period
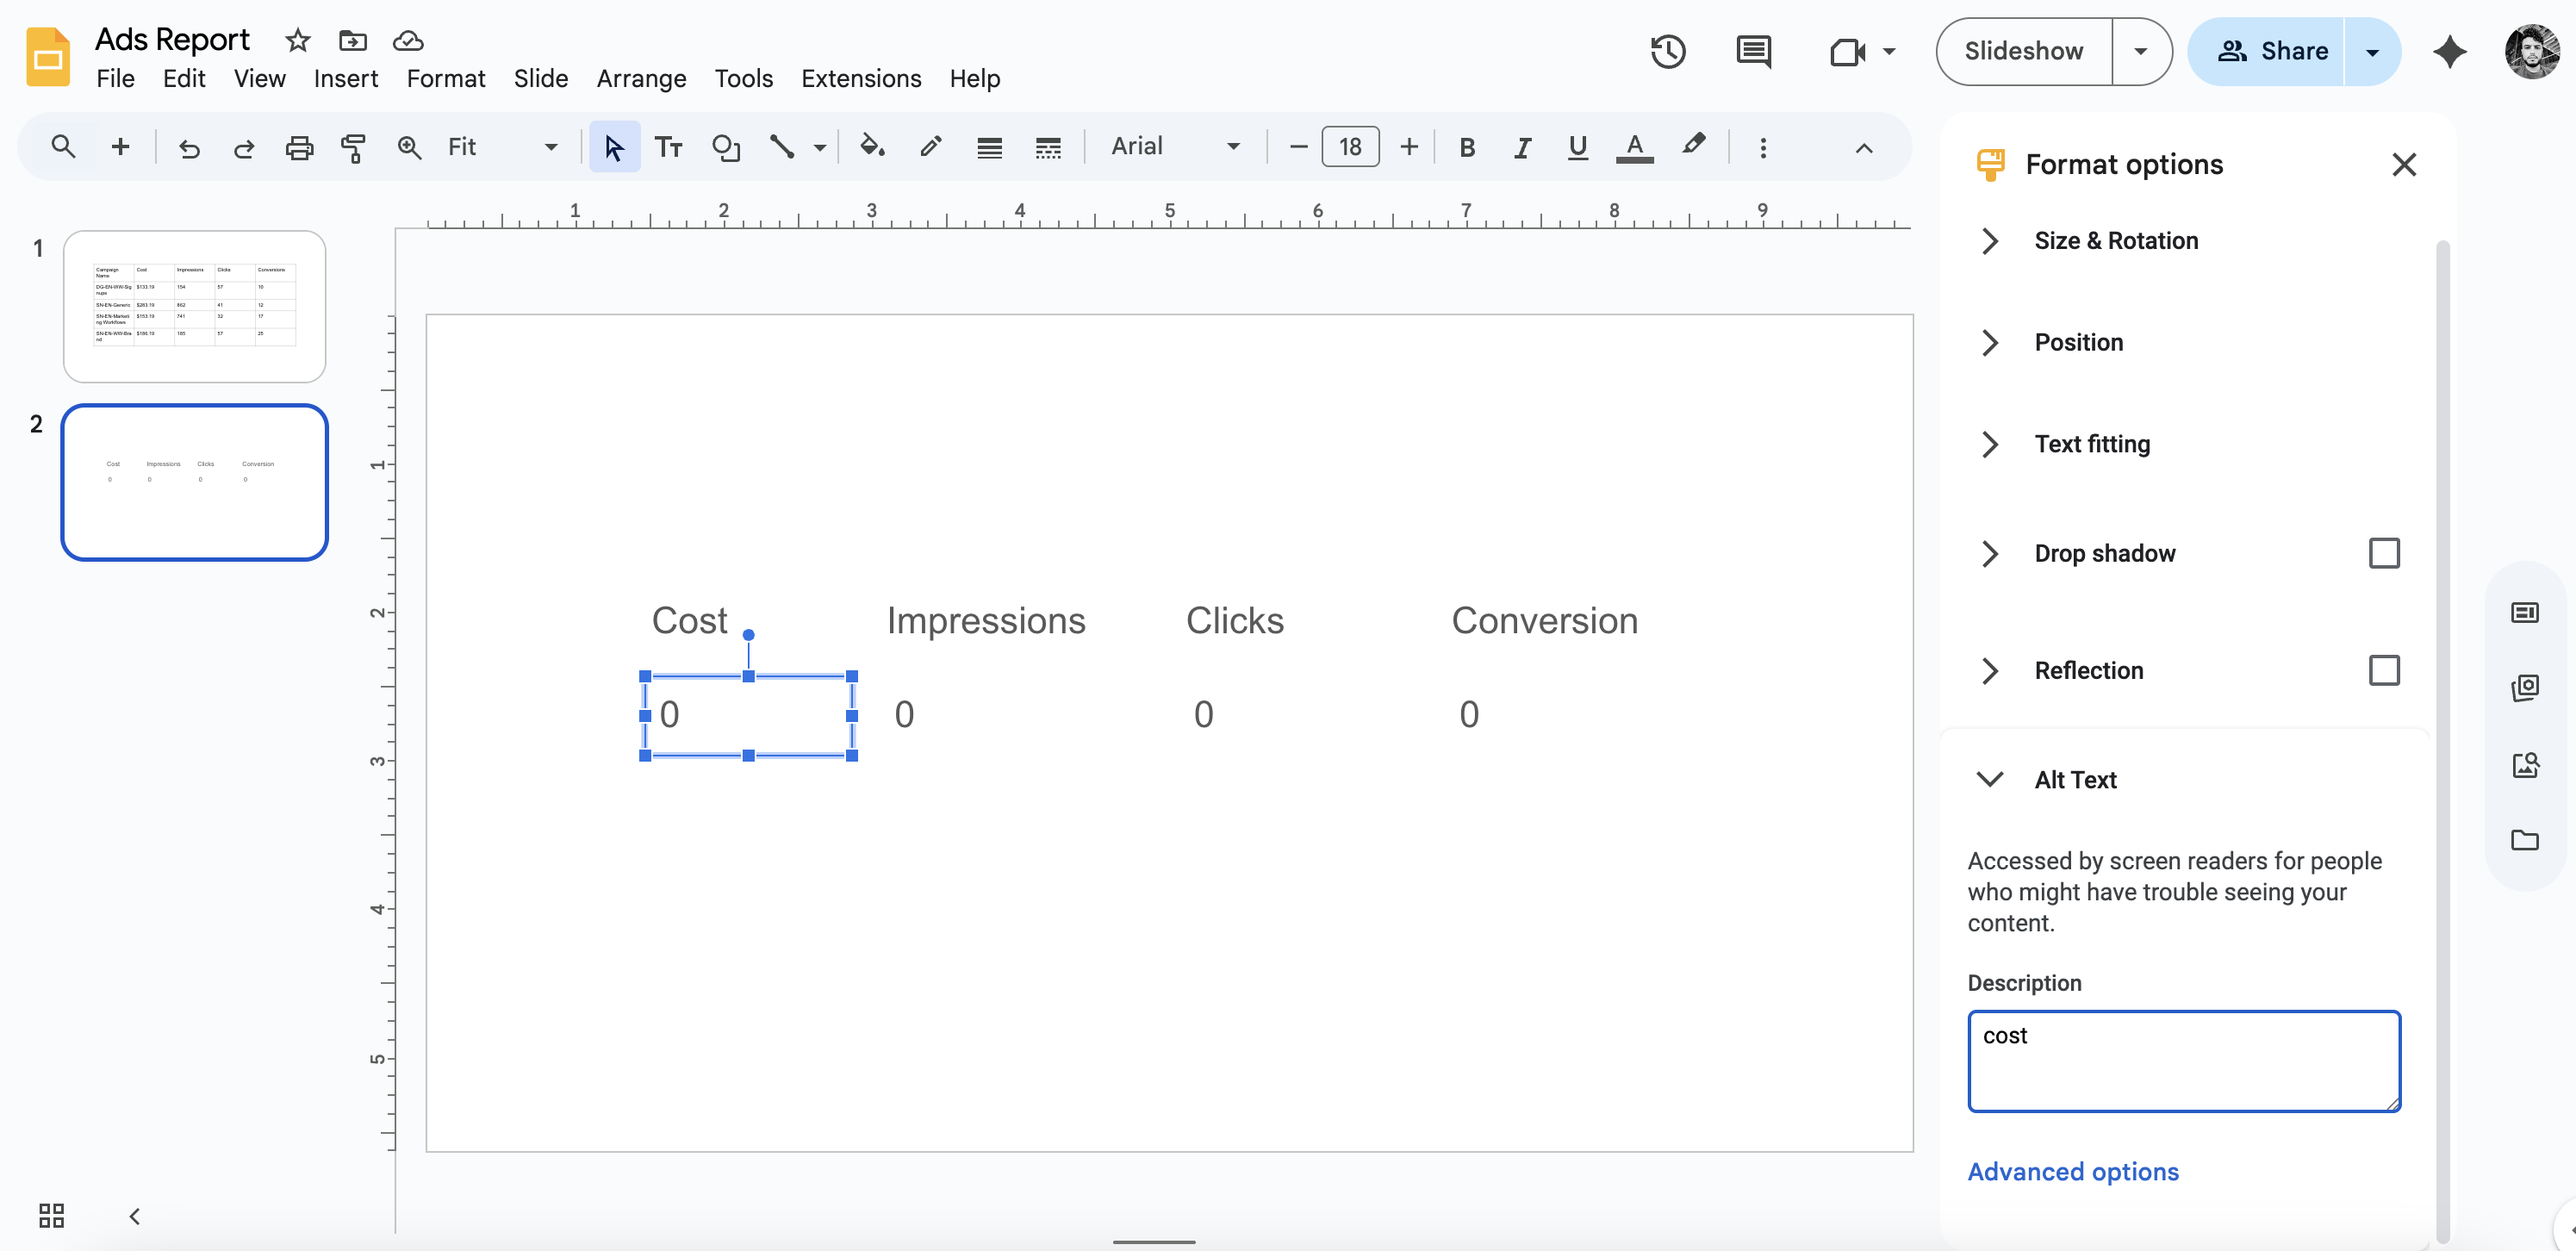
Step 1: Prepare Your Slide
- Create text boxes for each metric in your Google Slides presentation
- Set alt text for each text box to match the Google Ads metric names:
- Total cost box:
cost - Total clicks box:
clicks - Total impressions box:
impressions - Total conversions box:
conversions
- Total cost box:
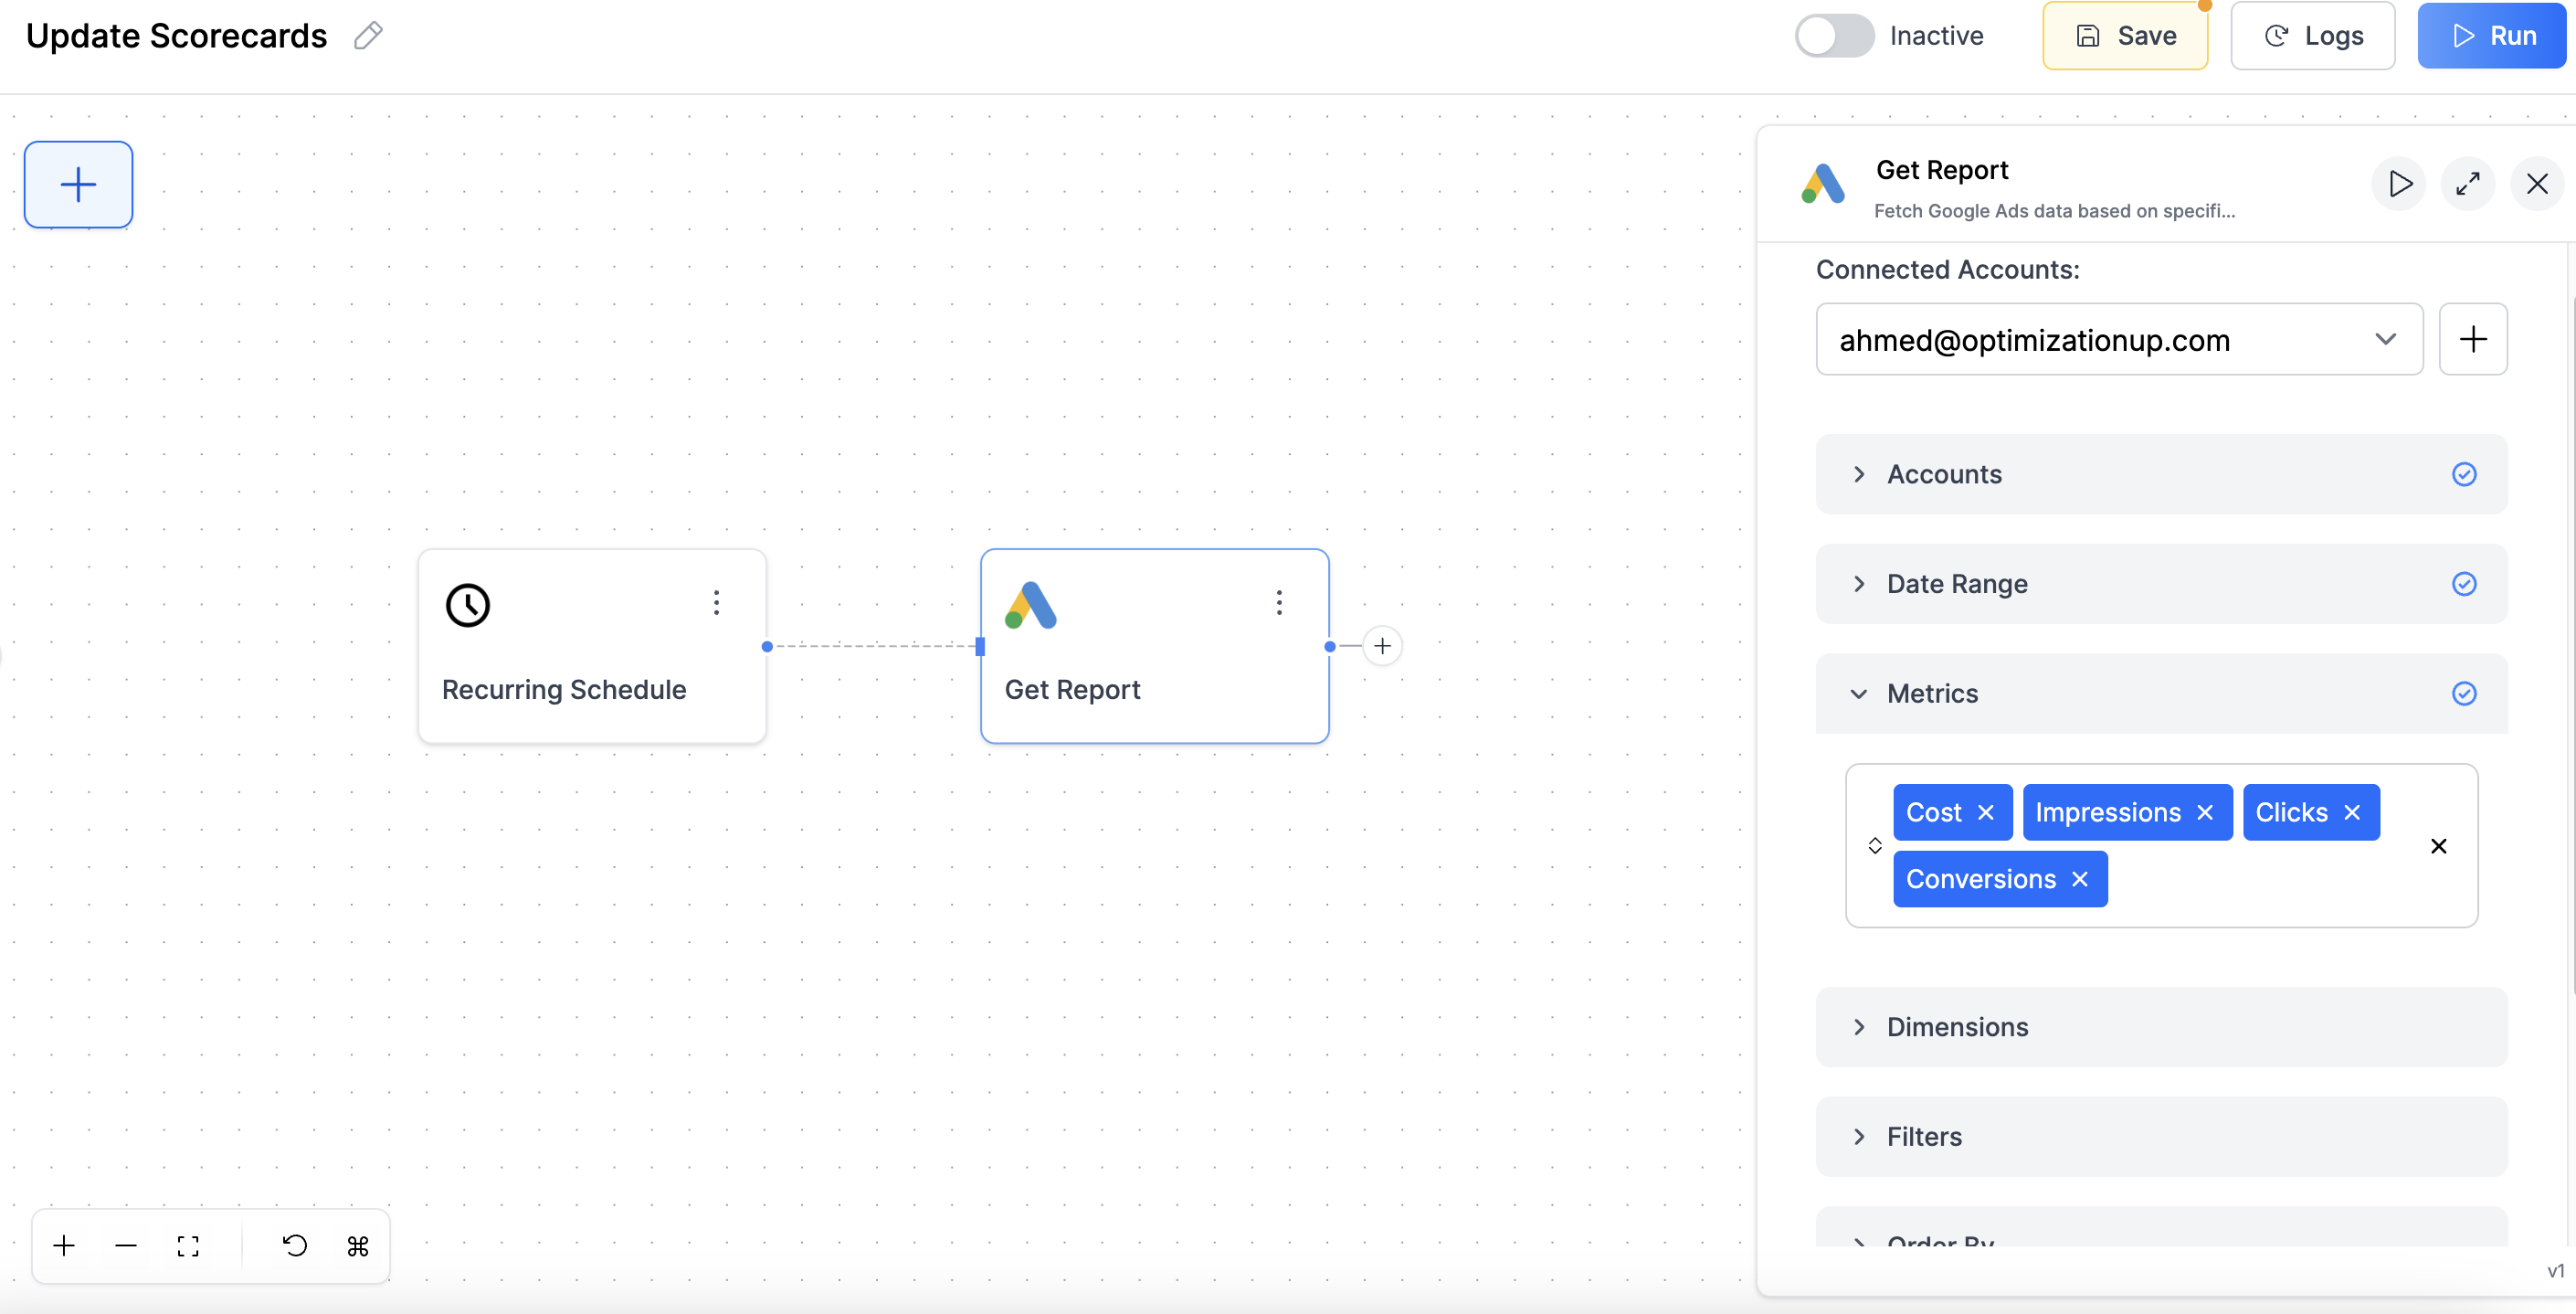
Step 2: Get Totals from Google Ads
- Add Node → Google Ads → Get Report
- Configure for totals:
- Accounts: Select your Google Ads account
- Date Range: Last week (or your preferred period)
- Metrics: Choose the metrics you want as scorecards:
- Cost
- Clicks
- Impressions
- Conversions
- Dimensions: Leave empty (this gives you totals, not per-campaign)
- Options:
- Display Currency Symbol (shows $ for cost)
- Compact Numbers (shows 10K instead of 10,000)
Step 3: Update Your Scorecard Text Boxes
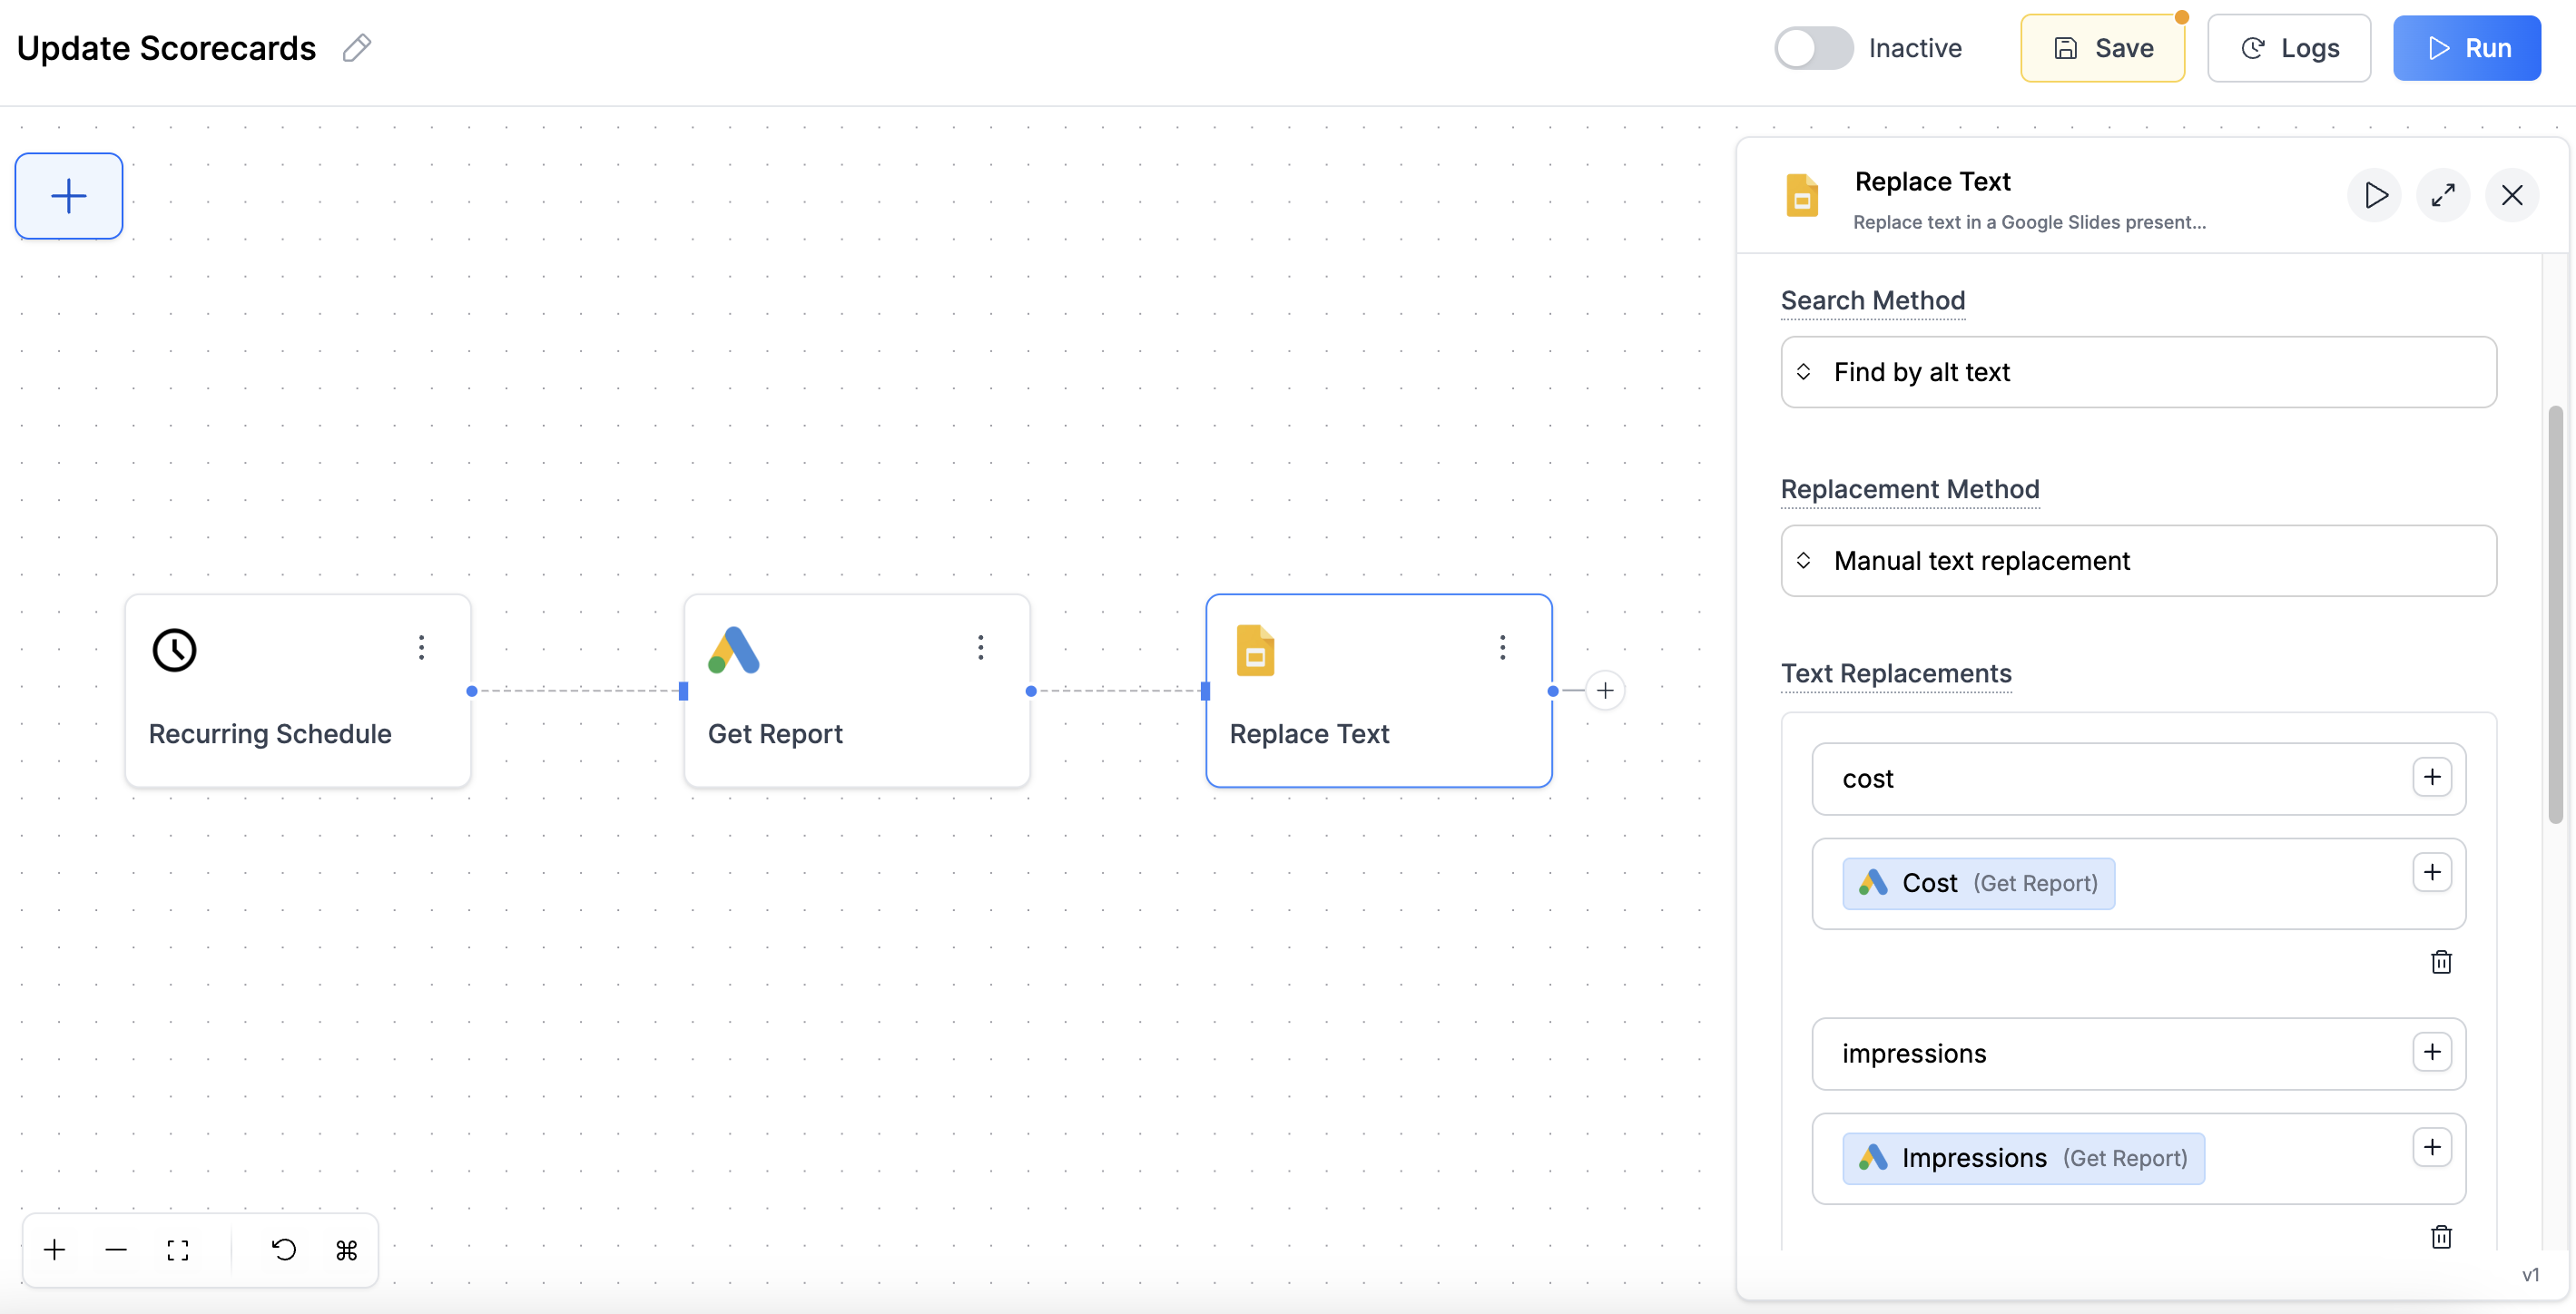
Add one Replace Text node for all metrics:- Add Node → Google Slides → Replace Text
- Connect it to your Google Ads totals node
- Configure:
- Presentation URL: Your slides URL
- Search Method: Find by alt text
- Replacement Method: Manual text replacement
- Text Replacements: Add each metric:
cost→ Connect Cost from Google Ads outputclicks→ Connect Clicks from Google Ads outputimpressions→ Connect Impressions from Google Ads outputconversions→ Connect Conversions from Google Ads output
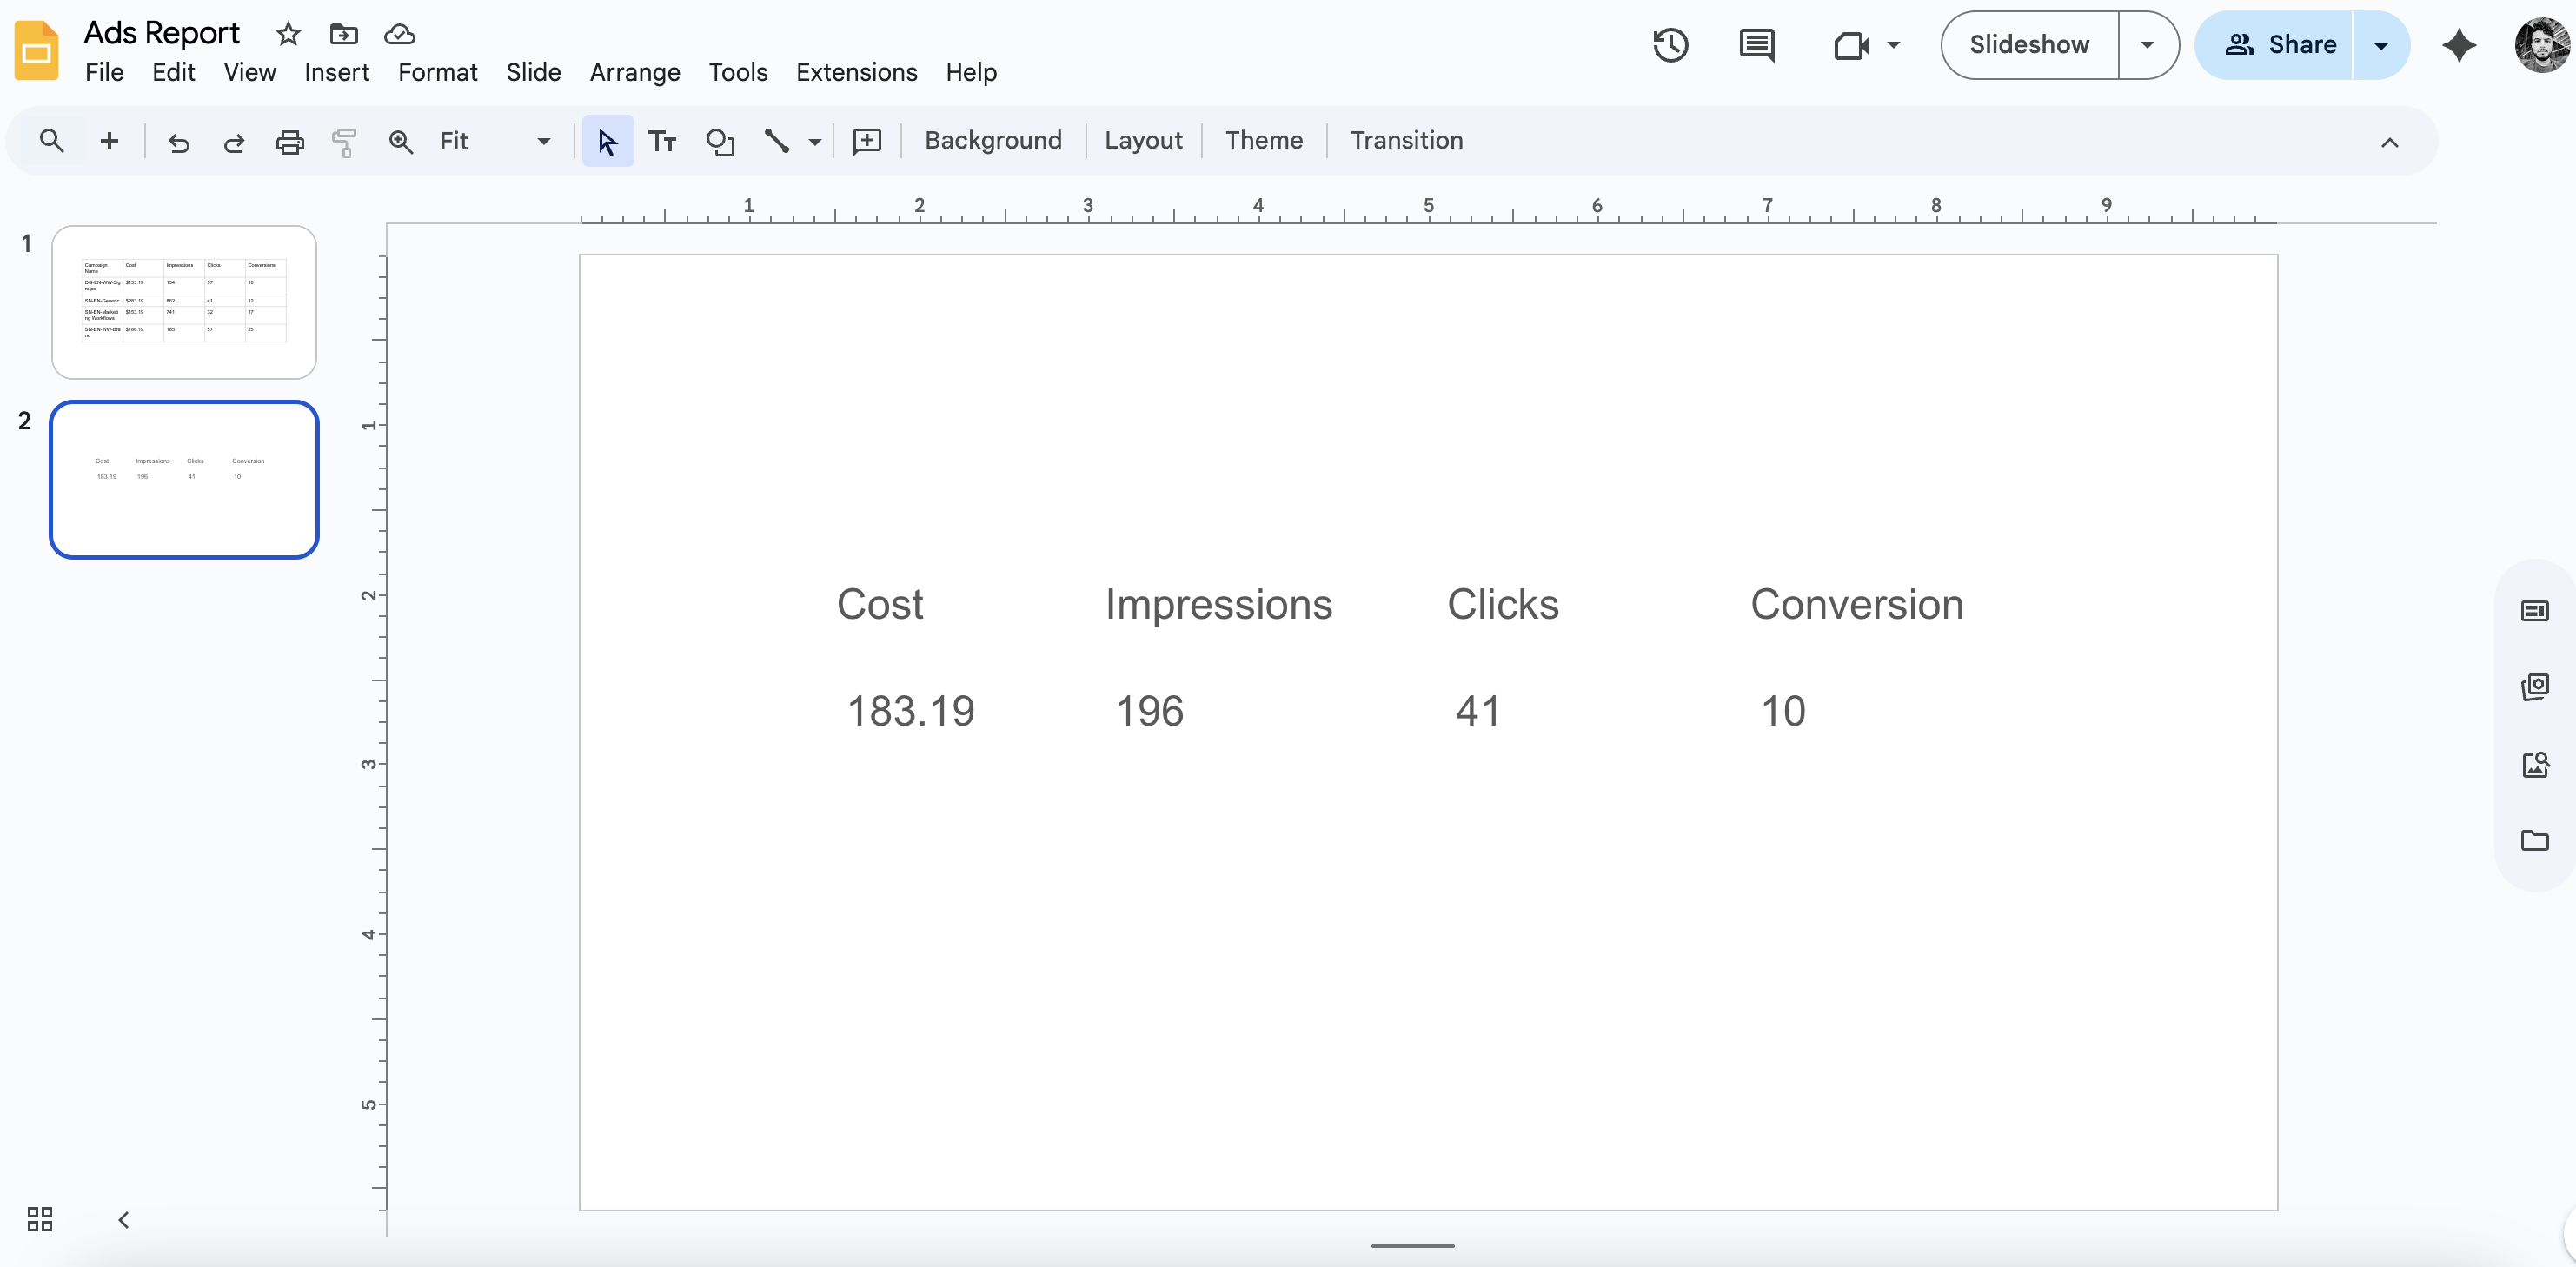
Step 4: Test Your Scorecards
- Run the workflow
- Check your Google Slides - each text box should show the total for that metric
- Your scorecards now update automatically with properly formatted numbers!
What Just Happened?
- Google Ads calculated totals automatically (no dimensions = totals)
- Alt text matched metric names -
costfinds cost,clicksfinds clicks - Numbers are pre-formatted with currency symbols and readable formatting
Creating Charts
Visual charts make data easier to understand. Here’s how to automate them.The Manual Process (What We’re Replacing)
Normally, to add charts to your Google Slides reports, you would:- Export data from Google Ads to a spreadsheet
- Create a chart in Google Sheets manually
- Copy the chart and paste it into Google Slides
- Every time you need fresh data, repeat steps 1-3
- Or manually click “refresh” buttons on existing charts
The Solution: Refresh Existing Charts
The key insight: When you paste a Google Sheets chart into Google Slides, the chart data doesn’t automatically update. You have to manually open the slides and click the “refresh” button every time the underlying data changes. This approach automates that clicking for you!Step 1: Get Your Data in Google Sheets First
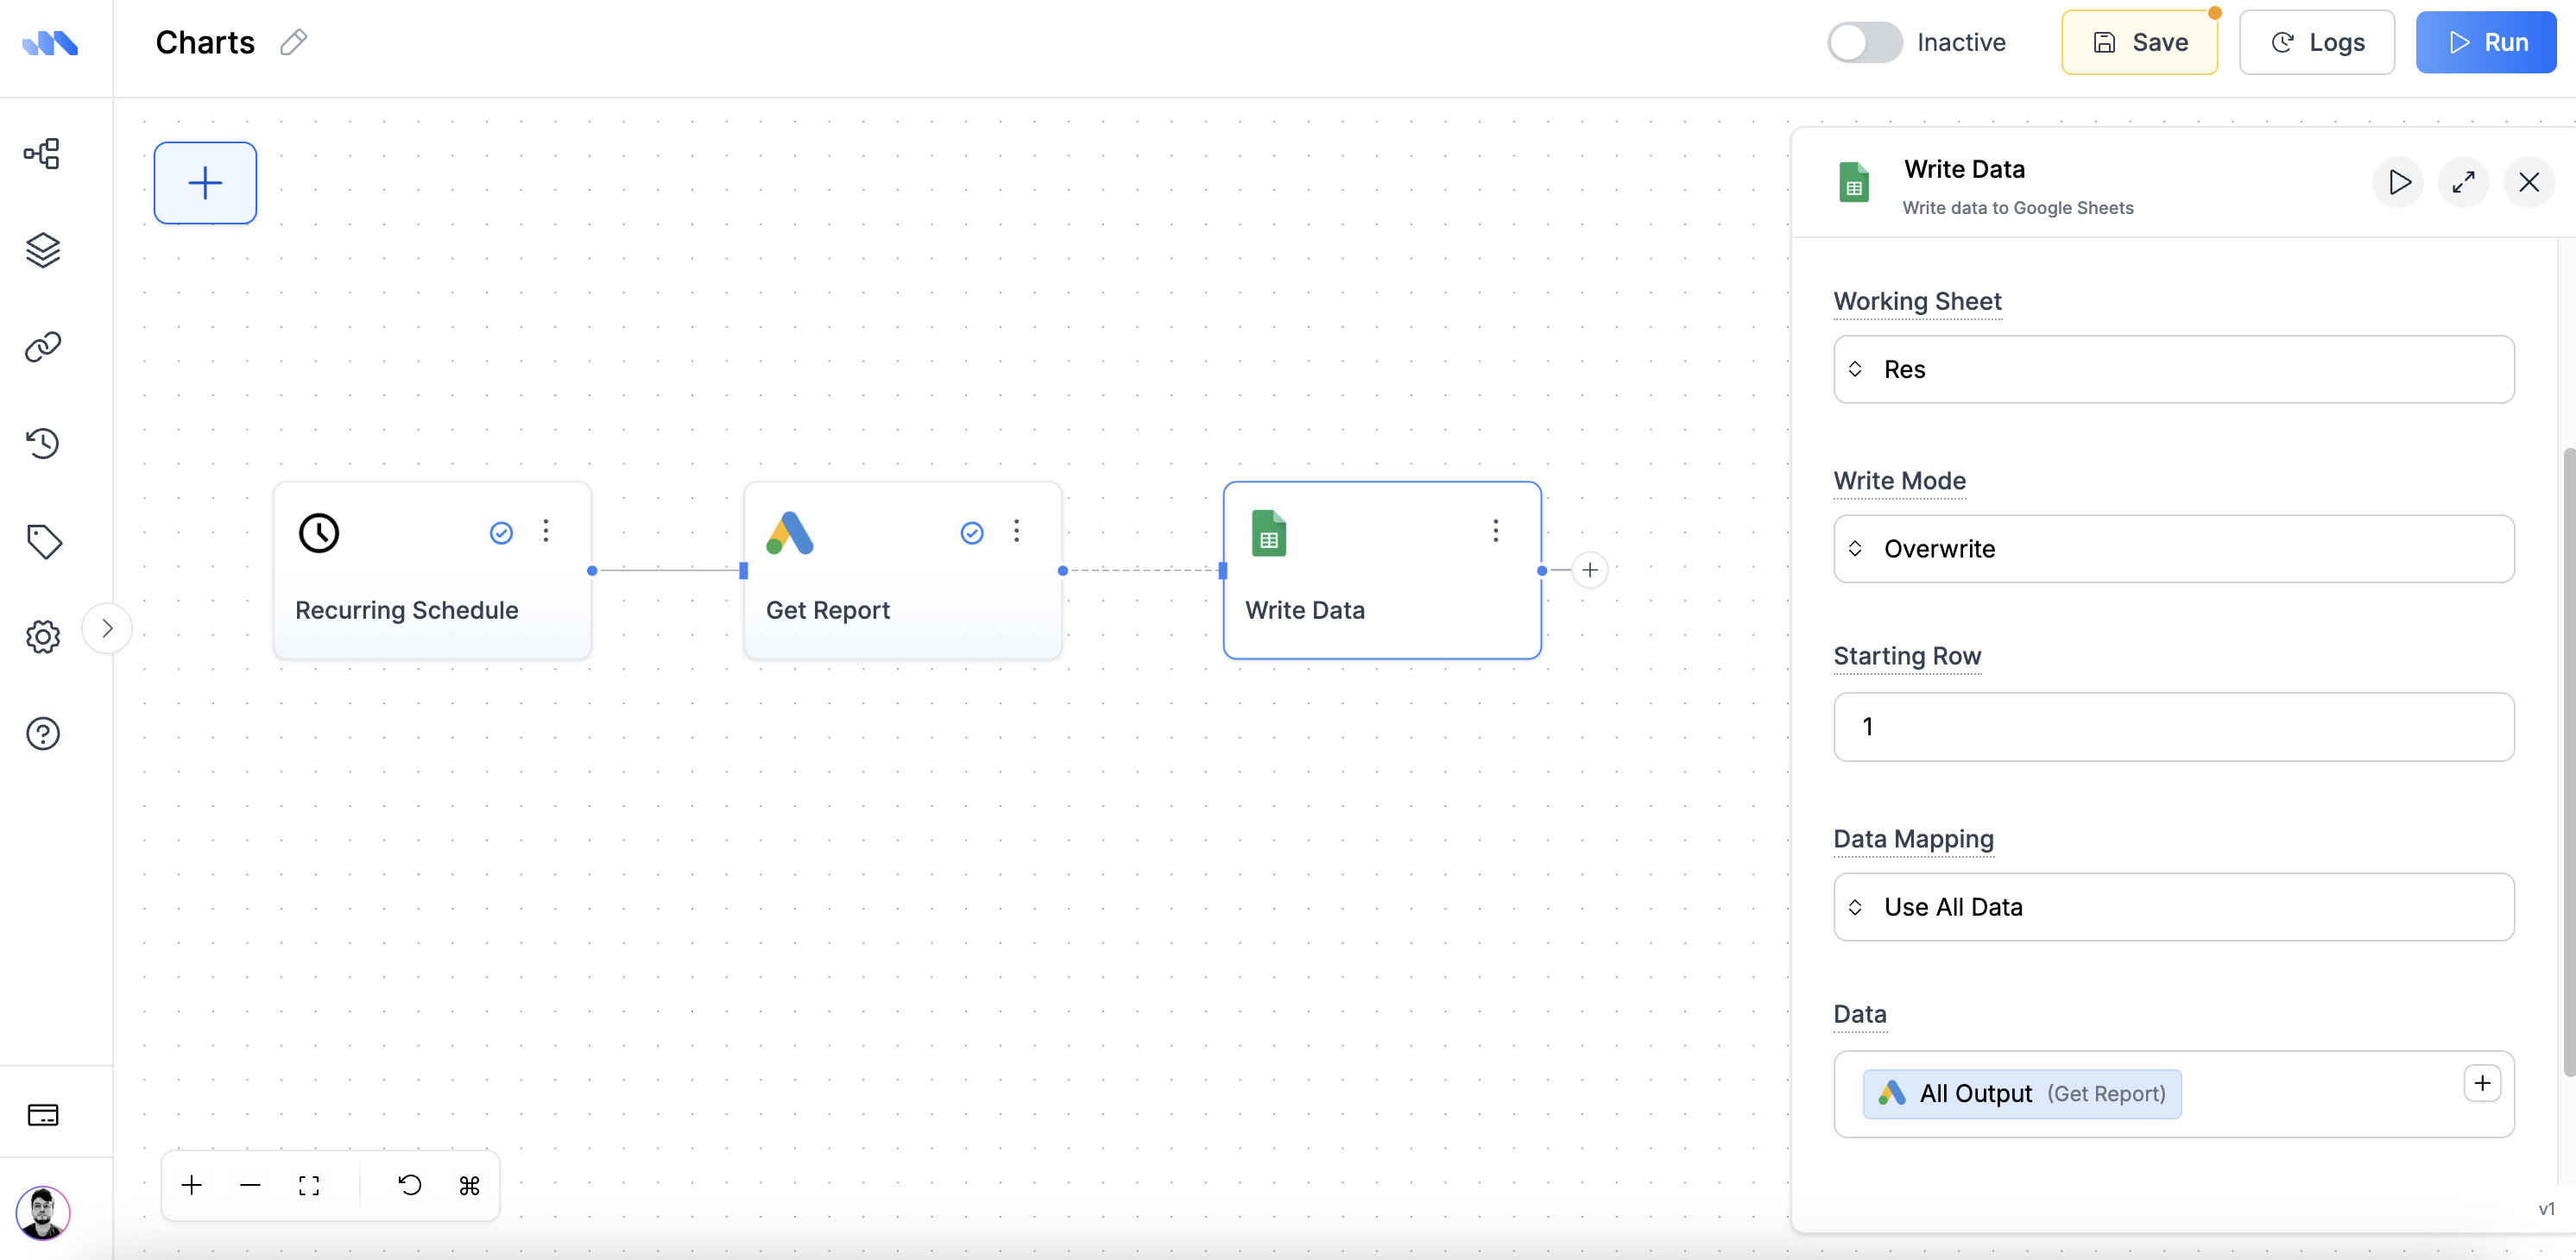
You need data before you can create a chart!- Add Node → Google Sheets → Write Data
- Connect it to your Google Ads node (from your table workflow)
-
Configure:
- Spreadsheet URL/ID: Create a new Google Sheets or use existing
- Working Sheet: “Chart Data” (or any sheet name)
- Write Mode: Overwrite (to replace old data)
- Starting Row: 1 (includes headers)
- Data: Connect Google Ads output
- Run the workflow once to populate your Google Sheets with data
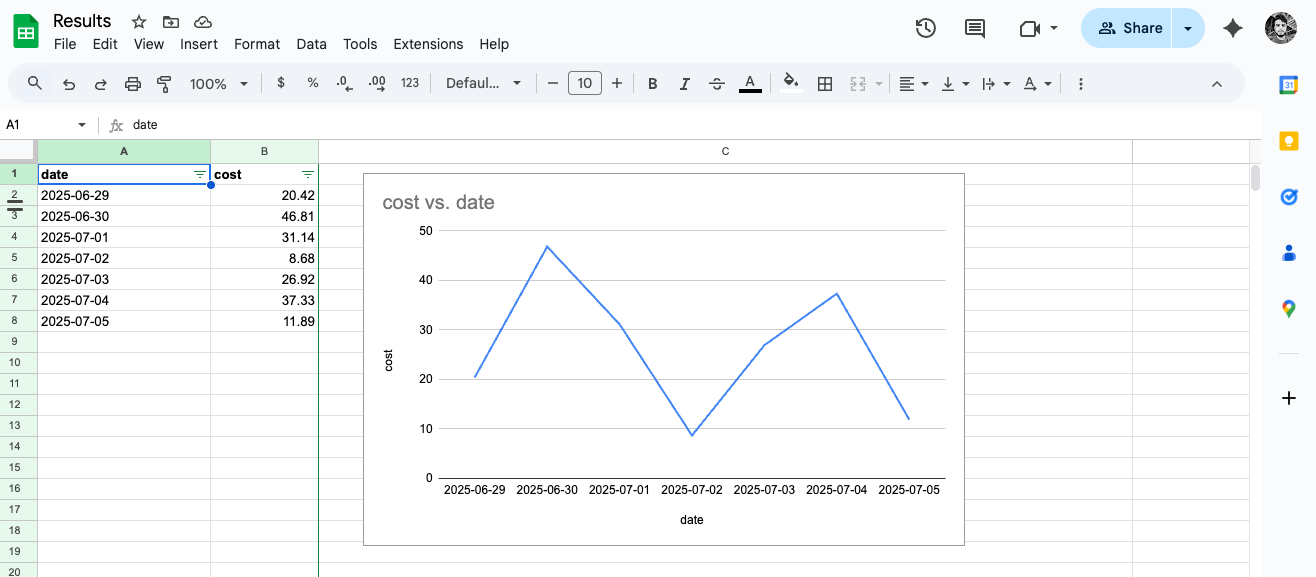
Step 2: Create Your Chart (One-Time Setup)
Now that you have data in Google Sheets:- Open your Google Sheets (the one from Step 1)
- You’ll see your Google Ads data with proper headers and formatting
- Select all the data (including headers)
- Insert → Chart
- Choose your preferred chart type
- Customize the styling - colors, titles, labels, etc.
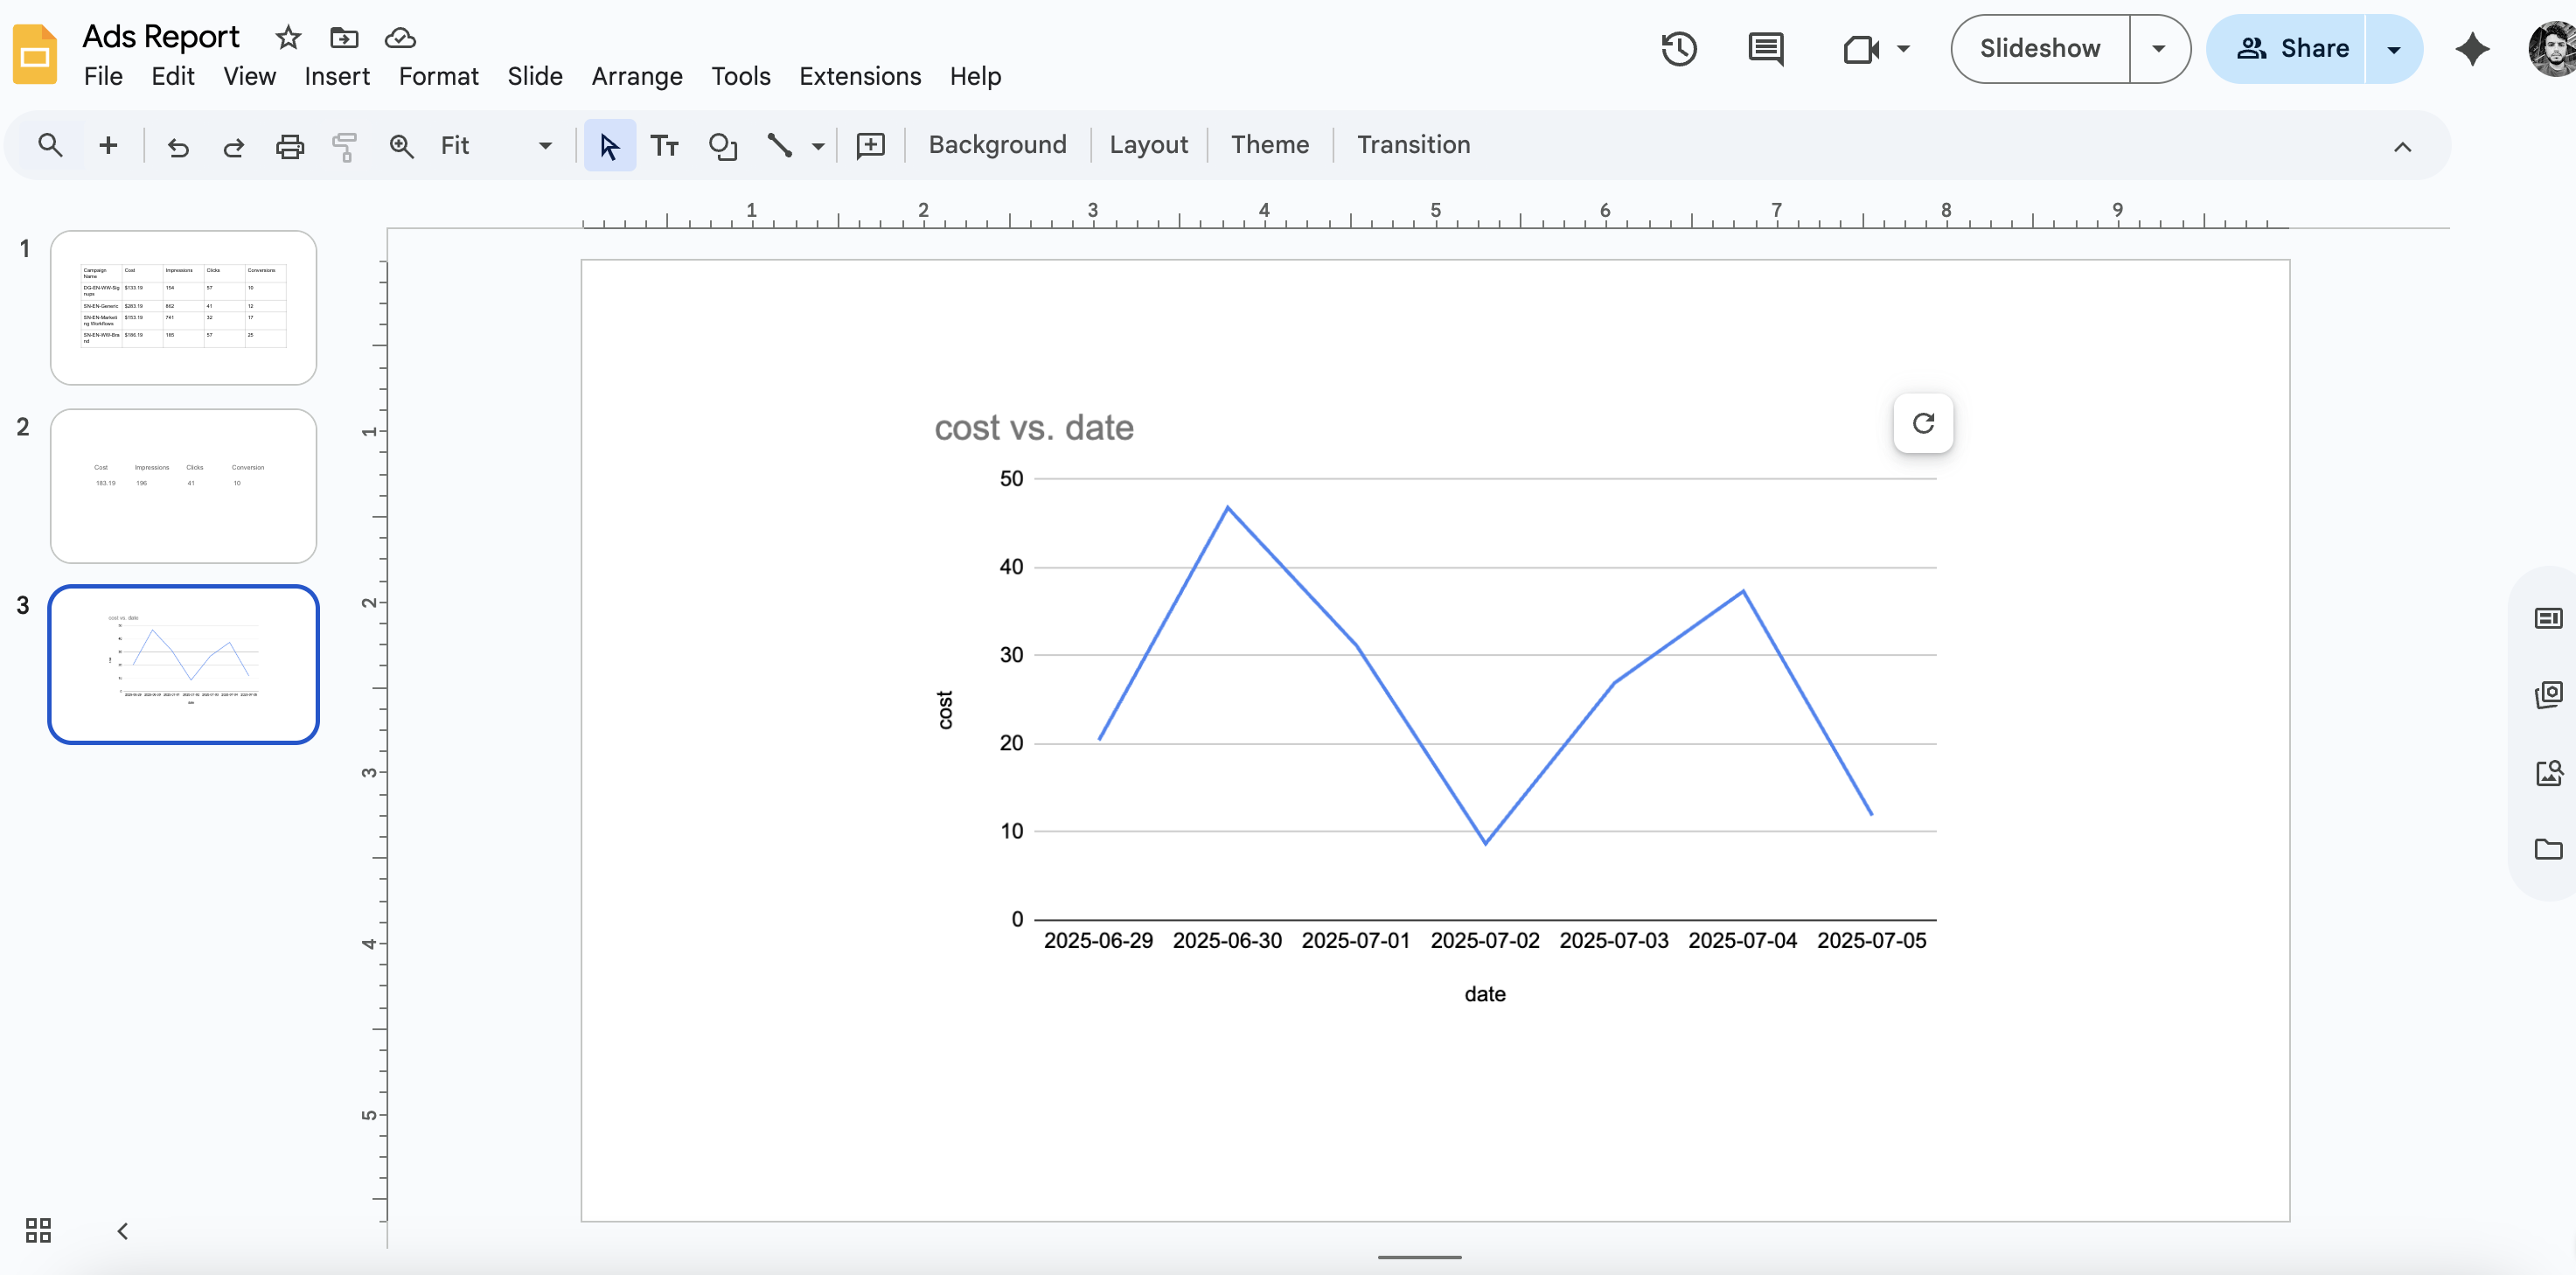
Step 3: Copy Chart to Google Slides
- Copy the chart from Google Sheets (right-click → Copy)
- Go to your Google Slides presentation
- Paste the chart where you want it
- Choose “Link to spreadsheet” when prompted (this is important!)
Step 4: Build the Automation
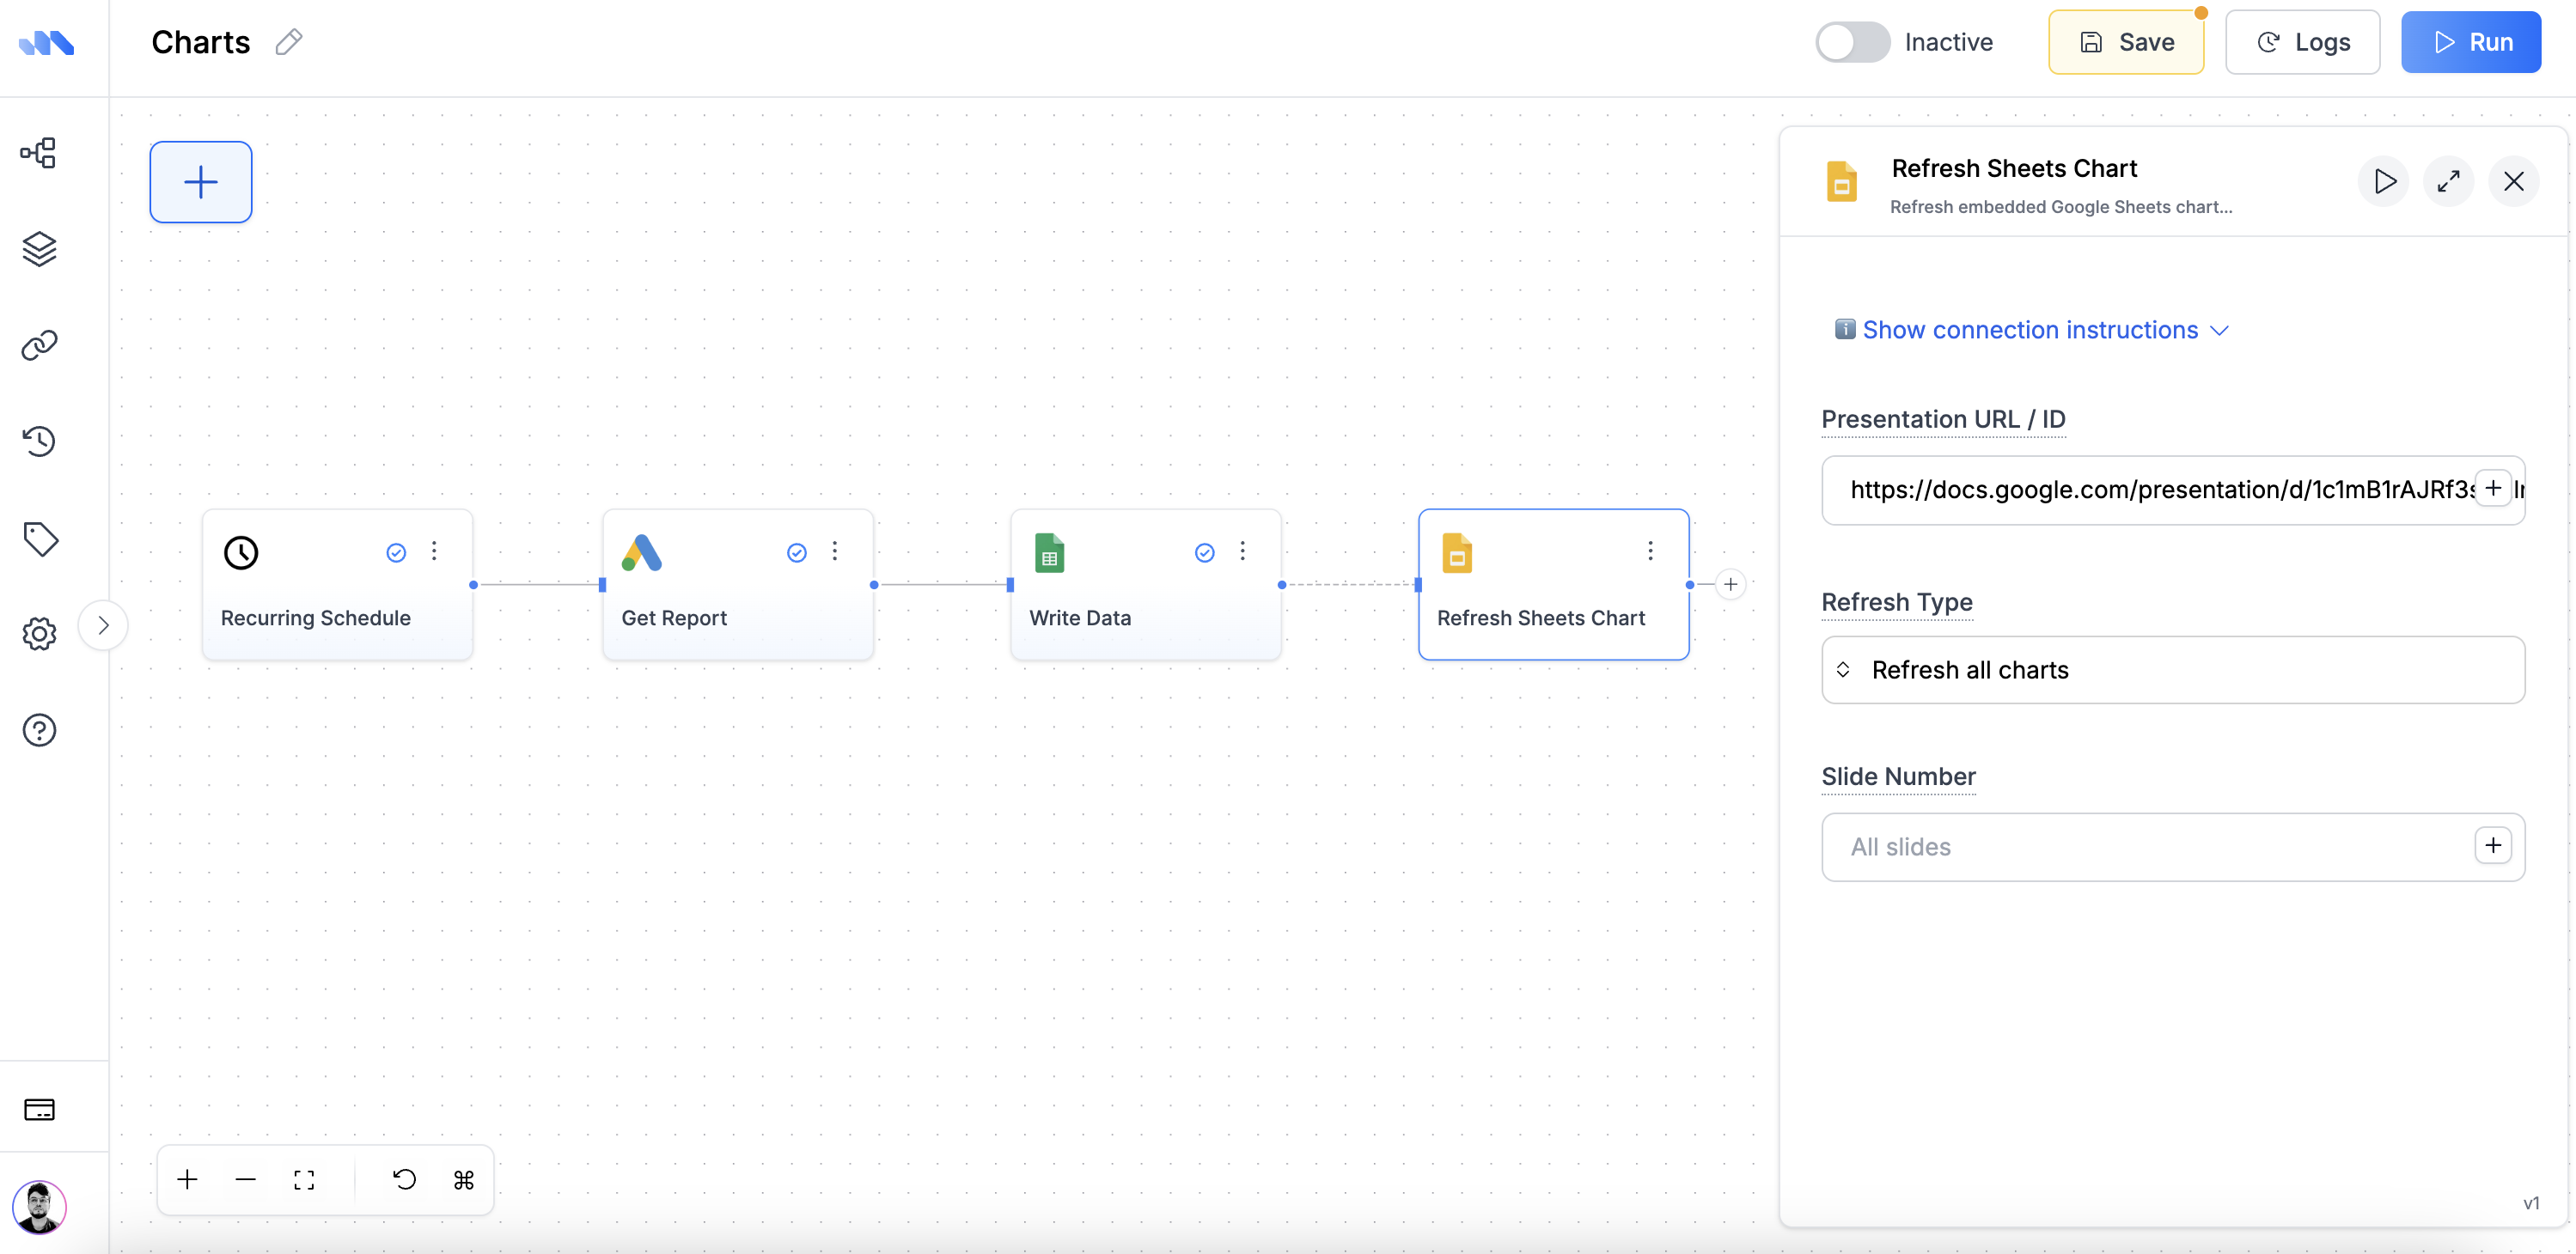
Now we’ll automate the data updates and chart refreshing: The data update is already done (from Step 1), so we just need to add the chart refresh:- Add Node → Google Slides → Refresh Sheets Chart
- Connect it to your Write Data node
- Configure:
- Presentation URL/ID: Your Google Slides URL
- Refresh Type: Refresh all charts
- Slide Number: Leave empty (refreshes all slides)
Step 5: Test the Chart Automation
- Run the workflow
- Check your Google Sheets - data should be updated
- Check your Google Slides - chart should show fresh data with no refresh button
spend_chart and use that in the Refresh Sheets Chart node.
Advanced: Dynamic Chart Creation for Templates
Advanced: Dynamic Chart Creation for Templates
There’s also an advanced approach using Get Chart and Add Sheets Chart nodes that’s primarily used in Markifact templates to create charts programmatically. This approach is more complex and mainly used when building reusable templates from scratch. For most users, the refresh approach above is simpler and more practical.Visit Get Chart Node and Add Sheets Chart Node for more details.
Creating Text & Insights
Replace static text with AI-generated insights that update automatically.The Manual Process (What We’re Replacing)
Normally, to add insights to your reports, you would:- Look at your Google Ads data manually
- Identify trends and patterns yourself
- Write summary text and insights
- Type or paste this text into your slides
- Repeat this analysis every reporting period
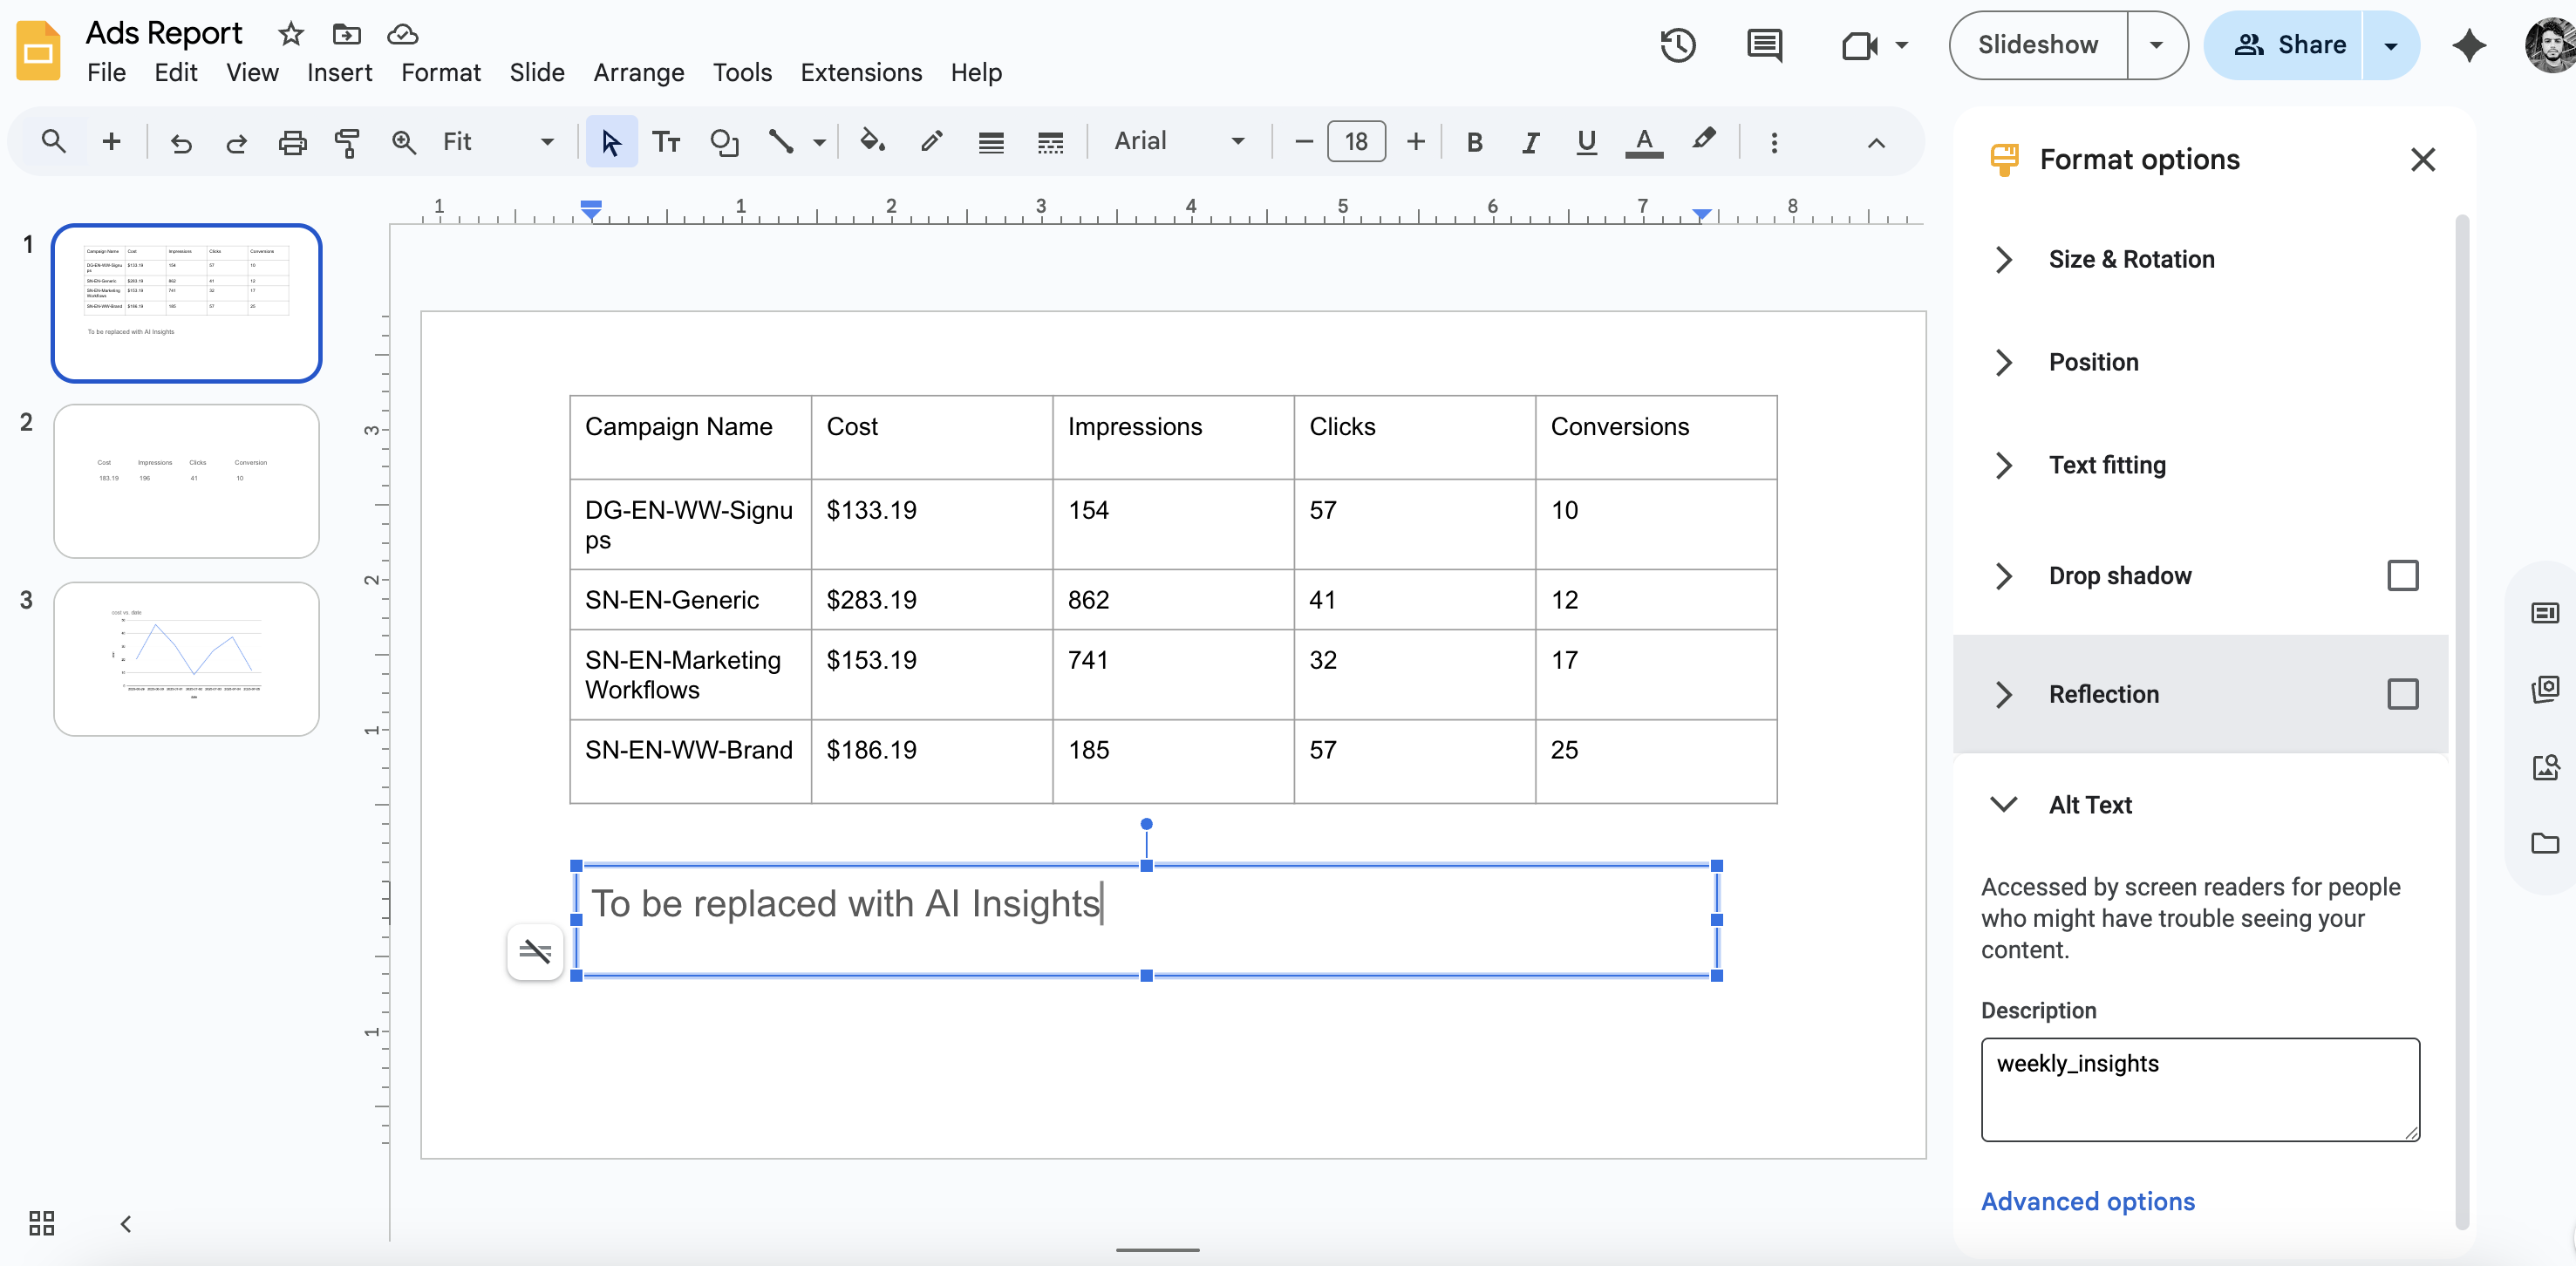
Step 1: Prepare Your Slide
- Insert → Text box
- Add placeholder text like “Weekly insights will appear here”
- Right-click → Alt text → Set to
weekly_insights
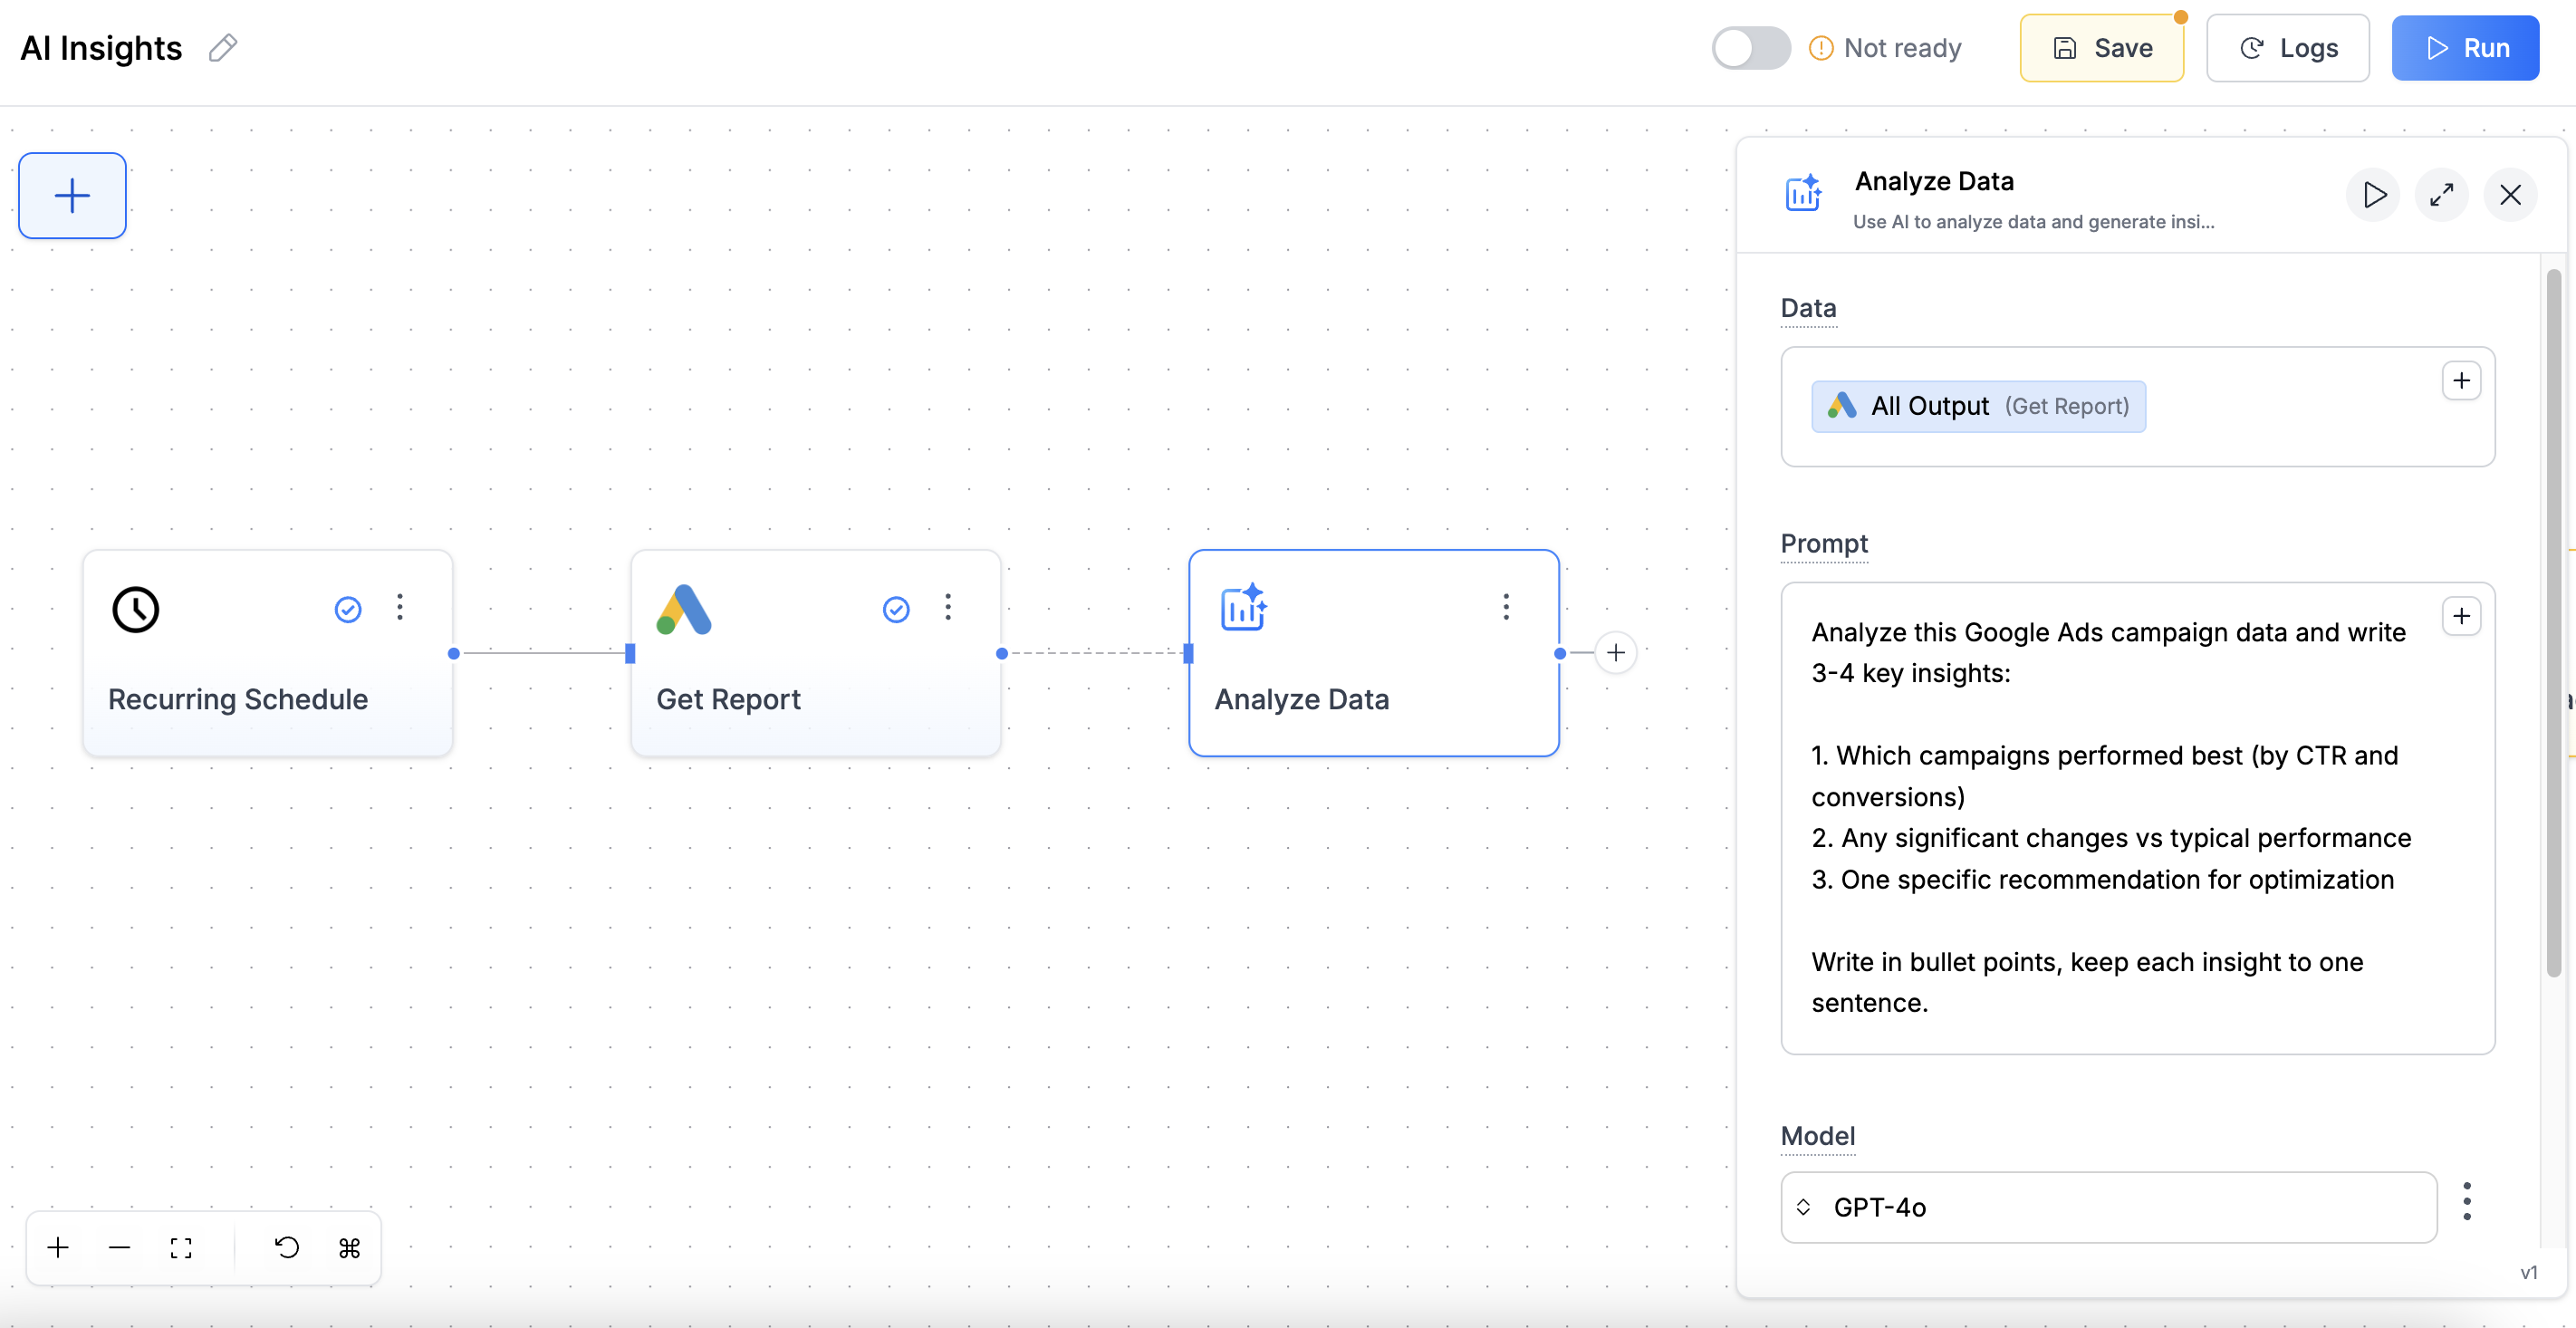
Step 2: Add AI Analysis
Add AI Node:- Add Node → AI → Analyze Data
- Connect to Google Ads node
-
Configure:
- Data: Connect Google Ads output
- Model: GPT-4o
- Prompt:
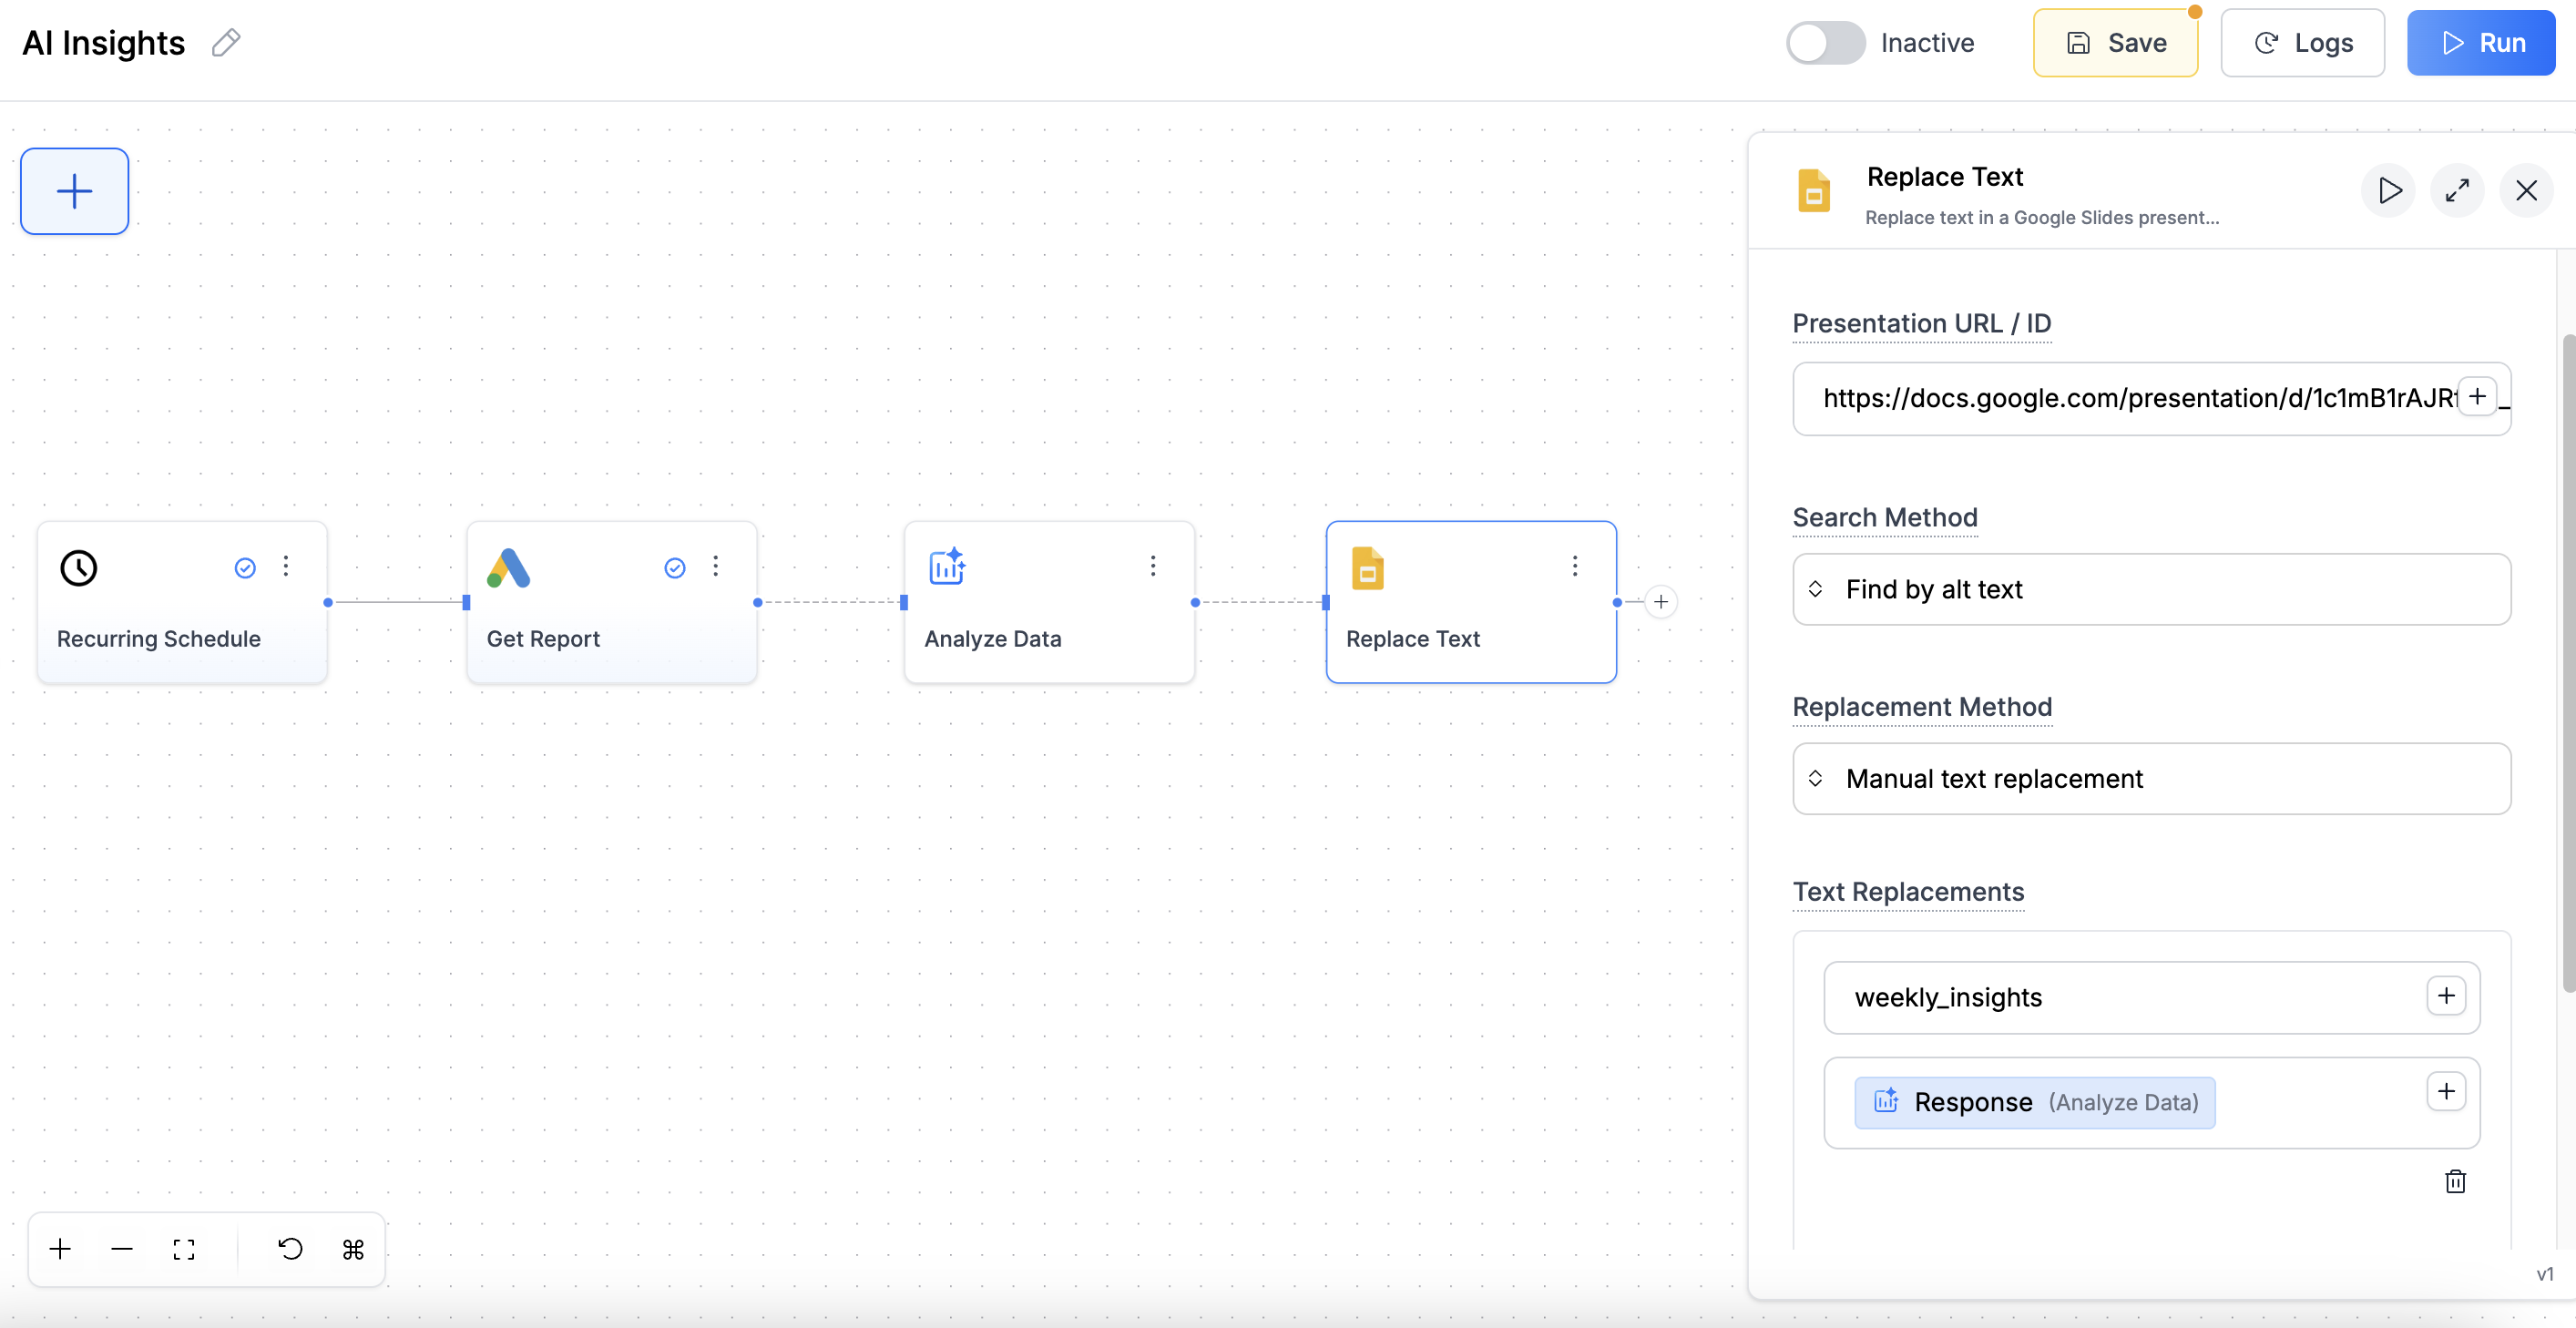
- Add Node → Google Slides → Replace Text
- Connect to AI Analyze node
- Configure:
- Presentation URL: Your slides URL
- Alt Text:
weekly_insights - New Text: Connect AI output
Step 3: Test AI Insights
- Run workflow
- Check your slide for AI-generated insights
- Adjust the prompt if you want different insights
Combining Elements
Once you’ve built individual elements, combine them into one master workflow:- Test each element separately before combining
- Use consistent alt text naming (e.g.,
campaign_table,spend_chart) - Start simple - add one element at a time
- Screenshots help - document your alt text setup
Troubleshooting
Table not updating
Table not updating
Check these: - Alt text matches exactly (case-sensitive) - Table exists in the
slide before running - Google Ads data is coming through (check node output) -
Make sure you’re using the correct presentation URL
Chart not appearing or not refreshing
Chart not appearing or not refreshing
Common issues: - Chart doesn’t exist in Google Sheets yet - Wrong Chart Index
(try 0, then 1, 2…) - Chart placeholder shape needs alt text - Make sure you
chose “Link to spreadsheet” when pasting the chart - Check that the Google
Sheets data updated first
AI text looks weird or incomplete
AI text looks weird or incomplete
Improve by: - Being more specific in your prompt - Using Force Python for
calculations - Testing prompt with sample data first - Check if the AI node is
receiving data (look at node outputs) - Try a simpler prompt if results are
inconsistent
Scorecards showing wrong numbers
Scorecards showing wrong numbers
Check these: - Alt text in slides matches metric names exactly (
cost, not
Cost) - Google Ads node has no dimensions selected (for totals) - Currency
and number formatting options are enabled - The Replace Text node is connected
to the right Google Ads outputWorkflow runs but slides don't update
Workflow runs but slides don't update
Common causes: - Wrong presentation URL (make sure it’s shareable) - Alt text
doesn’t match between slides and workflow - Elements don’t exist in slides yet
- Google authentication expired - reconnect your accounts
Google Ads data is empty or missing
Google Ads data is empty or missing
Check: - Google Ads account has data for the selected date range - Account
permissions are correct - Try a broader date range (last 30 days instead of
last week) - Verify the account selection in the Google Ads node
Charts show old data even after running
Charts show old data even after running
This usually means: - The chart refresh didn’t work - check if refresh button
still appears - Google Sheets data didn’t update - check the Write Data node
output - Chart is not properly linked to the spreadsheet - Try refreshing the
chart manually once to test the connection
Can I use this with other ad platforms?
Can I use this with other ad platforms?
Yes! Replace the Google Ads node with: - Meta Ads Get Report for
Facebook/Instagram ads - LinkedIn Ads Get Report for LinkedIn campaigns -
Microsoft Ads Get Report for Bing ads - Google Analytics Get Report
for website data All other steps remain the same.
How do I schedule this to run automatically?
How do I schedule this to run automatically?
Add a Scheduler node at the beginning: - Connect it to your first data
node (Google Ads, etc.) - Set frequency (daily, weekly, monthly) - Choose
day/time that works for your reporting schedule - Make sure your workflow is
set to “Active”
Can I update multiple presentations with one workflow?
Can I update multiple presentations with one workflow?
Yes, but you’ll need separate Google Slides nodes for each presentation: - Use
the same data nodes (Google Ads, AI, etc.) - Add multiple Update Table/Replace
Text nodes - Configure each with different presentation URLs - All will update
when the workflow runs
What’s Next?
Now you know how to automate the core elements of any marketing report: Apply to Other Channels:- Use Meta Ads Get Report instead of Google Ads
- Use Google Analytics Get Report for website data
- Use LinkedIn Ads Get Report for B2B campaigns
- Comparison tables (this month vs last month)
- Conditional formatting based on performance
- Image automation with AI-generated visuals