What You’ll Build
By the end of this guide, you’ll have automated workflows that:- Combine platform data into unified tables (Google Ads + Meta Ads in one table)
- Aggregate cross-platform data into a single view (e.g., total clicks, cost, ROAS)
- Standardize metrics across platforms (rename fields to match)
- Update Google Slides with consolidated performance data
The Manual Problem We’re Solving
Normally, creating cross-platform reports involves:- Export data from Google Ads, Meta Ads, LinkedIn Ads separately
- Manually rename columns to match (e.g., “Link Clicks” vs “Clicks”)
- Copy-paste into spreadsheets and merge data
- Calculate totals and comparisons manually
- Update slides with new data each reporting period
- Repeat every week/month
Prerequisites
Before starting, ensure you have:- Google Slides presentation ready for data
- Connected ad accounts (Google Ads, Meta Ads, LinkedIn Ads, etc.)
- Basic workflow knowledge (recommended: complete the single-platform guide first)
Method 1: Simple Merge (Same Column Names)
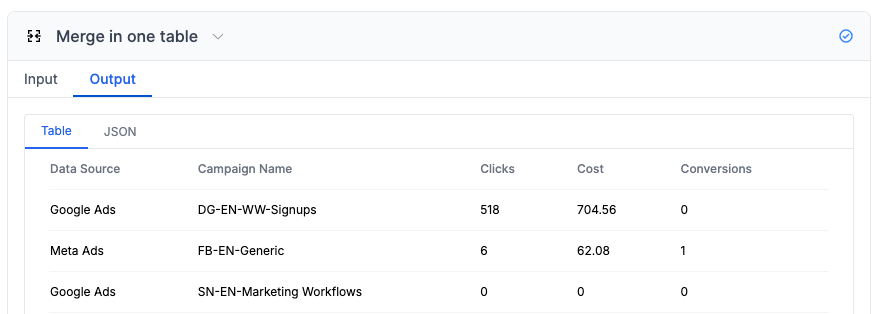
When your platforms return similar column names, you can merge data directly without renaming fields.Example: Google Ads + Meta Ads with Matching Columns
Scenario: You run campaigns on both Google Ads and Meta Ads and want to see all campaign performance in one table in your slides. Both platforms return:Campaign Name, Clicks, Impressions, Cost
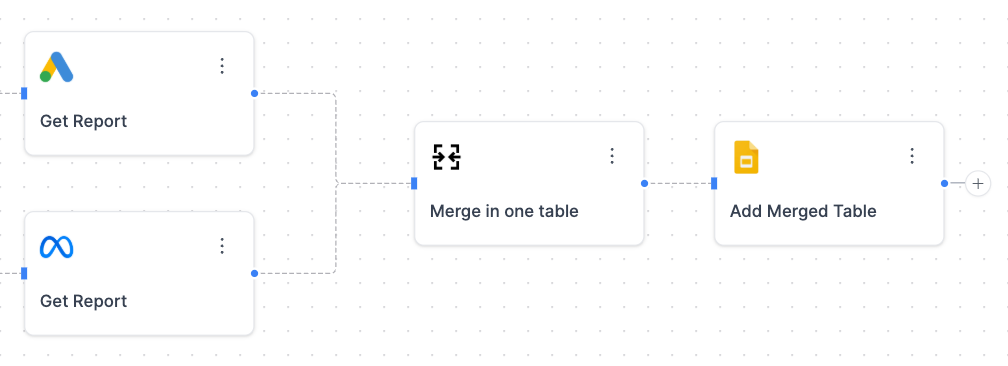
Workflow Structure:
Step 1: Get Data from Each Platform
Add Google Ads Node:- Add Node → Google Ads → Get Report
- Configure your date range and metrics
- Select Metrics: Clicks, Impressions, Cost
- Select Dimensions: Data Source, Campaign Name
- Add Node → Meta Ads → Get Report
- Configure same date range
- Select Metrics: Link Clicks, Impressions, Cost
- Select Dimensions: Data Source, Campaign Name
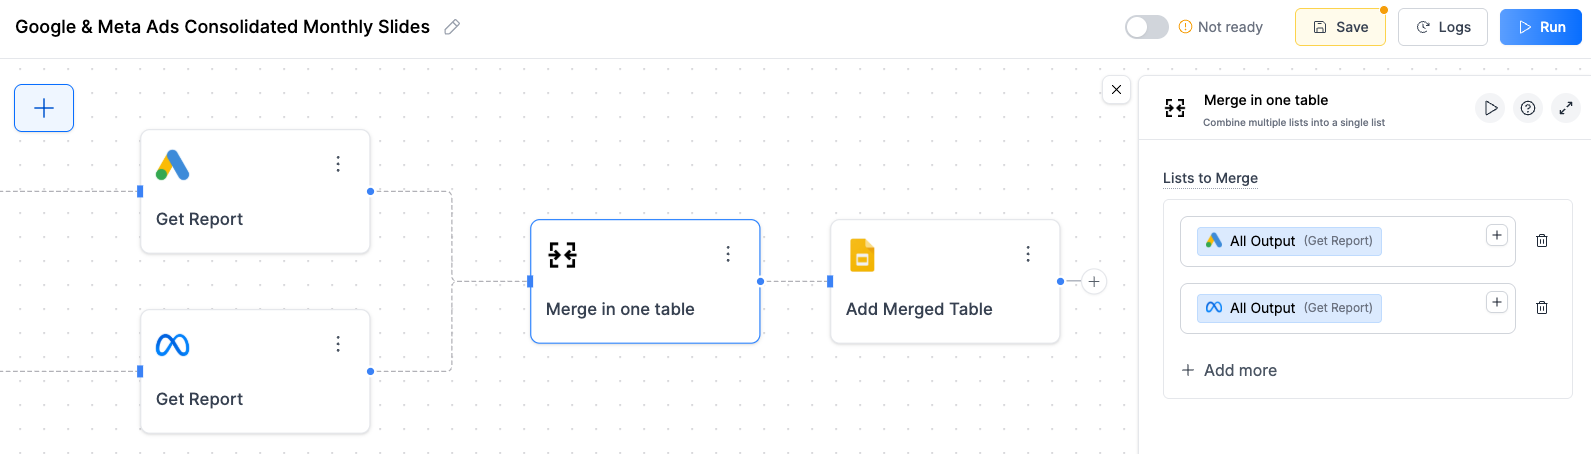
Step 2: Merge the Data
Add List Merge Node:- Add Node → List Tools → Merge
- Connect both ad platform outputs
- Configure:
- List 1: Google Ads output
- List 2: Meta Ads output
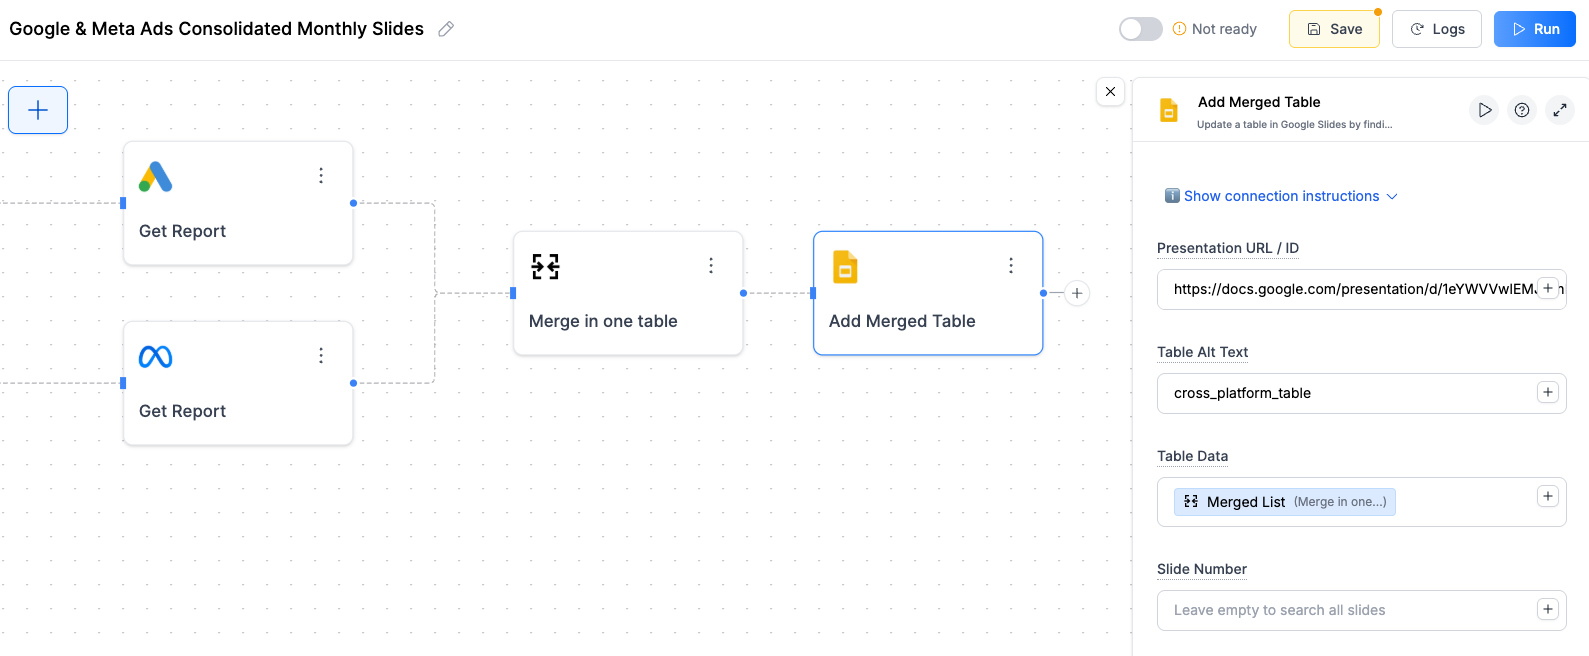
Step 3: Update Google Slides
Prepare Your Slide:- Insert → Table in Google Slides
- Right-click → Alt text → Set to
cross_platform_table
- Add Node → Google Slides → Update Table
- Connect to List Merge output
- Configure:
- Presentation URL: Your slides URL
- Table Alt Text:
cross_platform_table - Table Data: Connect merged data
Method 2: Rename Fields + Merge (Different Column Names)
When platforms use different column names for the same metrics, we need to rename them first to ensure consistency. Otherwise, you will get a different field name for each platform, making it messy.Example: Standardizing Different Metric Names
The Problem: Each platform uses different names for the same thing.- Google Ads: “Clicks” and “Conversions”
- Meta Ads: “Link Clicks” and “Purchases”
Step 1: Get Data from Each Platform
Add Google Ads Node:- Add Node → Google Ads → Get Report
- Configure your date range
- Select Metrics: Clicks, Cost, Conversions
- Select Dimensions: Data Source, Campaign Name
- Add Node → Meta Ads → Get Report
- Configure same date range
- Select Metrics: Link Clicks, Cost, Purchases
- Select Dimensions: Data Source, Campaign Name
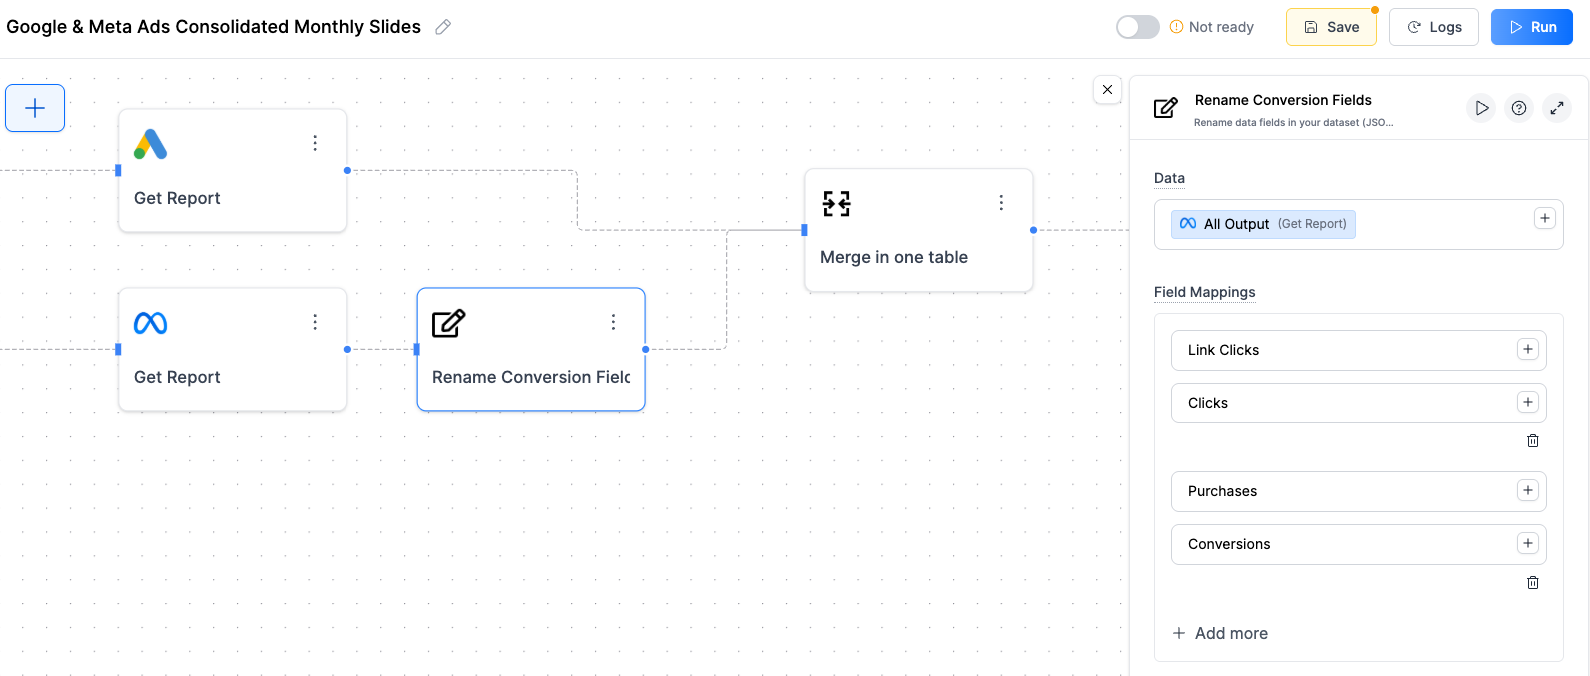
Step 2: Rename Meta Ads Fields to Match Google Ads
Rename Meta Ads Fields:- Add Node → Utilities → Rename Conversion Fields
- Connect to Meta Ads output
- Configure field mappings:
- Link Clicks → Clicks
- Purchases → Conversions
Step 3: Merge Standardized Data
Add List Merge Node:- Add Node → List Tools → Merge
- Connect Google Ads output and renamed Meta Ads output
- Merge Type: Combine
Data Source, Campaign Name, Clicks, Conversions, Cost
Method 3: AI Aggregation (Cross-Platform Totals)
Use AI to aggregate data across platforms and create summary insights with totals and comparisons.Example: Combined Performance Summary
The Goal: Instead of seeing individual campaign rows, create one summary showing your total advertising performance across all platforms. Perfect for executive dashboards where you want to show:- Total advertising spend across all channels
- Total Scorecards (clicks, conversions, ctr)
- Ecommerce ROAS (take revenue from Shopify and Cost from ads)
Step 1: Collect Data
Pull data from each platform you want to include in your summary. The AI will handle standardizing field names automatically.Step 2: AI Aggregation
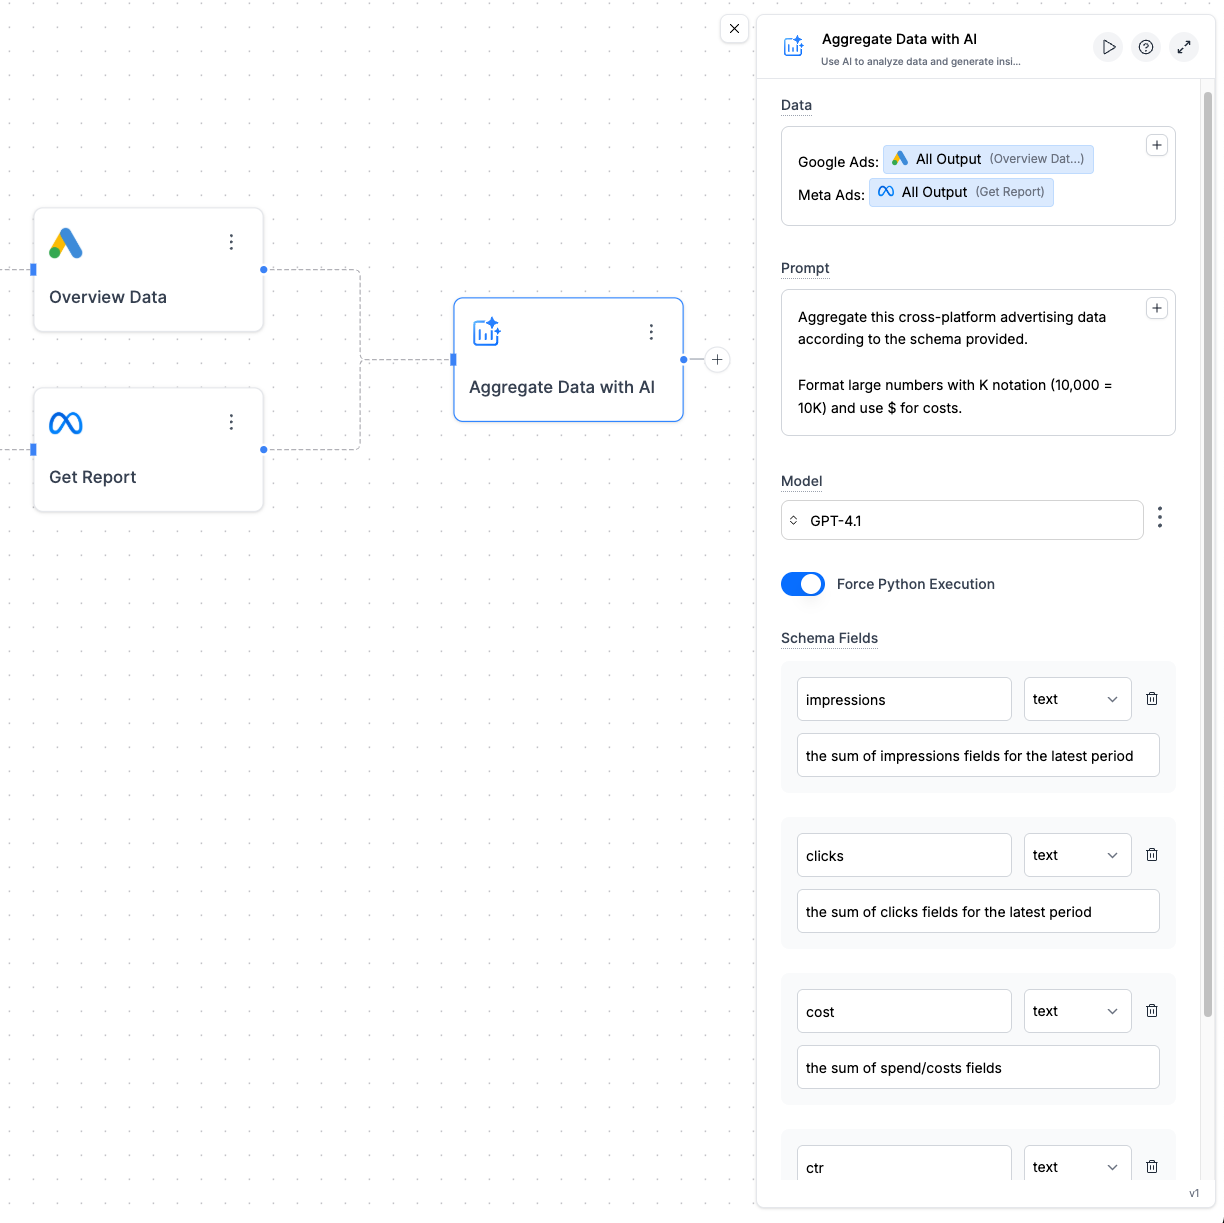
Add AI Analyze Data Node:- Add Node → AI → Analyze Data
- Connect Google Ads and Meta Ads outputs
- Configure:
- Google Ads: Connect Google Ads output
- Meta Ads: Connect Meta Ads output
cost(text) - “the sum of spend/costs fields”clicks(text) - “the sum of clicks fields”impressions(text) - “the sum of impressions fields”conversions(text) - “the sum of conversions fields”ctr(text) - “(the sum of clicks fields) divided by (the sum of impressions fields). Add % sign to the number”
Step 3: Update Slides with Summary
Create Summary Table:- Add Node → Google Slides → Update Table
- Connect to AI aggregation output
- Table Alt Text:
platform_summary_table
| Cost | Clicks | Impressions | Conversions | CTR |
|---|---|---|---|---|
| $4.3K | 2.15K | 83K | 77 | 2.6% |
Which Method Should You Use?
Choose the right approach based on what you want to show in your slides:| Method | Best For | Result |
|---|---|---|
| Method 1: Simple Merge | Campaign-level analysis | One table with all campaigns from both platforms |
| Method 2: Rename + Merge | When platforms use different field names | Standardized table with consistent column names |
| Method 3: AI Aggregation | Executive summaries and totals | Single row with combined performance across all platforms |
Troubleshooting
Merge not working - getting inconsistent columns
Merge not working - getting inconsistent columns
Common causes:
- Field name mismatches (check rename configuration)
- Different date ranges between platforms
- Platform connection issues (test individual nodes first)
- Data format differences (dates, currencies, numbers)
AI aggregation returning wrong calculations
AI aggregation returning wrong calculations
Issues to check:
- Force Python Execution is enabled
- Data format consistency between platforms
- Prompt clarity - be more specific about calculations
Slides not updating with merged data
Slides not updating with merged data
Check these:
- Alt text matches exactly (case-sensitive)
- Table size can accommodate all platform data
- Data structure - ensure merged data is properly formatted
- Connection order - make sure data flows correctly through merge node
Different platforms have different metrics
Different platforms have different metrics
When platforms measure things differently:
- Map similar metrics (Link Clicks → Clicks)
- Document differences in your presentation
- Use AI to explain metric differences in insights
- Consider separate sections for platform-specific metrics