Inputs
| Field | Type | Required | Description |
|---|---|---|---|
| Spreadsheet URL/ID | Text | Yes | Google Sheets document link or ID |
| Working Sheet | Select | Yes | Which sheet tab contains the chart |
| Alt Text | Text | Yes | The alt text identifier of the chart you want to find |
How It Works
This node searches your specified Google Sheets tab for a chart with matching alt text and retrieves it for use in your workflow. The chart’s alt text acts as a unique identifier, making it easy to reference specific visualizations. 🔗 Common Workflow Pattern: Get Chart → Add Sheets Chart = Automated chart insertion into presentationsAlt Text Setup
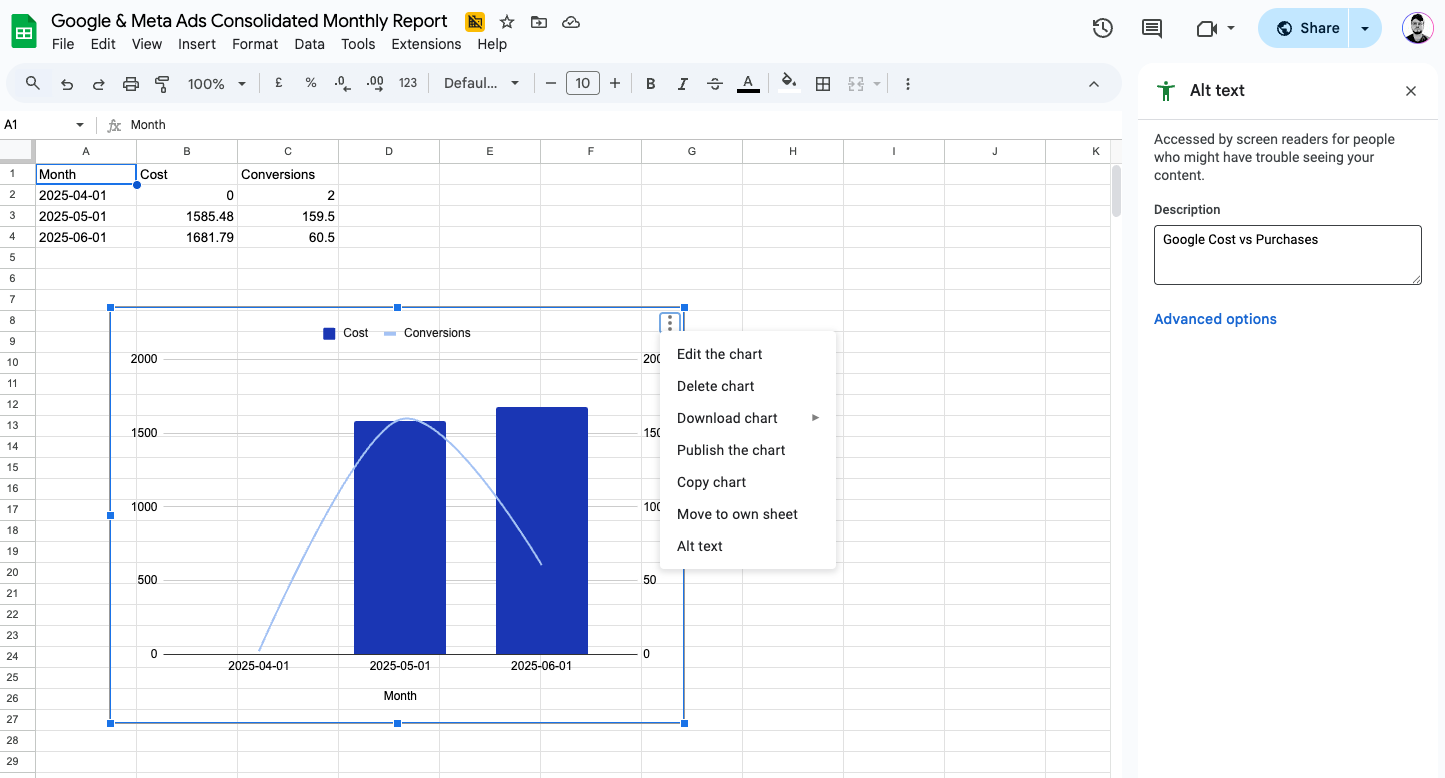
Before using this node, you need to set alt text for your charts in Google Sheets:- Click on your chart in Google Sheets
- Click the 3-dots menu (⋮) in the chart’s toolbar
- Select “Alt text” from the dropdown
- Enter a descriptive name (e.g., “Monthly Sales Chart”, “Q4 Performance”)
- Save the alt text
- Use descriptive, unique names
- Keep names consistent across similar charts
- Use clear identification (date, metric, purpose)
Configuration Examples
Complete Chart-to-Slides Workflow
Scenario: Automatically insert Google Sheets chart into Google Slides presentation Step 1 - Get Chart:- Spreadsheet URL/ID: Your analytics spreadsheet
- Working Sheet: “Sales Dashboard”
- Alt Text: “Monthly Sales Chart”
Retrieve Sales Performance Chart
Scenario: Get a specific sales chart for use in presentations Configuration:- Spreadsheet URL/ID: Your analytics spreadsheet
- Working Sheet: “Sales Dashboard”
- Alt Text: “Monthly Sales Chart”
Best Practices
Alt Text Naming Convention
- Use descriptive names: “Campaign Performance Q3” not “Chart1”
- Include key identifiers: metrics, time periods, data source
- Avoid special characters: stick to letters, numbers, spaces
- Keep names unique: don’t duplicate alt text in the same sheet
Chart Preparation
- Set alt text immediately after creating charts
- Document chart purposes and their alt text names
- Test chart retrieval before building complex workflows
- Update alt text when chart data or purpose changes
Workflow Design
- Verify alt text spelling matches exactly
- Handle missing charts gracefully in your workflows
- Use consistent sheet organization for easier chart management
- Test with different charts to ensure reliability
Error Prevention
- Double-check alt text before running workflows
- Ensure charts exist on the specified sheet
- Verify sheet names match your spreadsheet
- Test on copies before modifying original sheets
Credit Cost
1 credit per successful run.FAQ
How do I set alt text for a chart in Google Sheets?
How do I set alt text for a chart in Google Sheets?
Click on your chart, then click the 3-dots menu (⋮) and select ‘Alt text’. Enter a descriptive name like “Monthly Sales Chart” and save. This alt text becomes the identifier for finding the chart in your workflows.
What happens if I use alt text that doesn't exist?
What happens if I use alt text that doesn't exist?
The node will fail to find the chart and return an error. Always verify the alt text exists and is spelled exactly as entered in Google Sheets. Check for typos, extra spaces, or case sensitivity issues.
Can I retrieve multiple charts at once?
Can I retrieve multiple charts at once?
No, each Get Chart node retrieves one chart at a time. To get multiple charts, use multiple Get Chart nodes in your workflow, each with different alt text values for the specific charts you need.
Does the chart data need to be up-to-date?
Does the chart data need to be up-to-date?
The node retrieves the chart as it currently appears in Google Sheets. If your chart data has been updated in the spreadsheet, the retrieved chart will reflect those changes automatically.
What can I do with a retrieved chart?
What can I do with a retrieved chart?
Most common use: Connect to Add Sheets Chart to automatically insert charts into Google Slides presentations. This creates a powerful automation where you can update data in Sheets and have it automatically flow to your presentations. Retrieved charts can also be used with other workflow nodes that accept chart/image inputs.
Are there any limitations on chart types?
Are there any limitations on chart types?
All Google Sheets chart types are supported - bar charts, line graphs, pie charts, scatter plots, etc. The node retrieves whatever chart type exists with the specified alt text.
Can I use the same alt text on different sheets?
Can I use the same alt text on different sheets?
Yes, alt text only needs to be unique within each sheet tab. You can have “Sales Chart” on both “Q3 Data” and “Q4 Data” sheets - just make sure to specify the correct working sheet when retrieving.
What if my chart alt text has special characters?
What if my chart alt text has special characters?
Stick to letters, numbers, and spaces for best results. While some special characters might work, they can cause issues in workflows. Use descriptive names like “Campaign ROI 2024” instead of “Campaign ROI (2024)!”.