Markdown Formatting Supported! When using Alt Text mode, your replacement text can include basic markdown formatting:
**bold**for bold text*italic*for italic text[link text](url)for clickable hyperlinks
Inputs
| Field | Type | Required | Description |
|---|---|---|---|
| Presentation URL/ID | Text | Yes | Google Slides presentation link or ID |
| Search Method | Select | Yes | How to find text: Regular text or Alt text |
| Replacement Method | Select | Yes | Manual (few replacements) or Structured Data (Bulk) |
| Text Replacements | Key-Value | Yes | What to find and what to replace it with. Supports markdown: **bold**, *italic*, [text](url) |
| Structured Data | Table | No | Marketing data in any simple table format (for bulk updates) |
| Slide Number | Number | No | Specific slide to update (leave empty for all slides) |
Search Methods: Two Ways to Find Text
Regular Text Mode
Finds and replaces actual visible text in your slides.- Use for: One-time updates, simple changes
- Example: Replace “Last Month” with “December 2024”
Alt Text Mode
Uses hidden “alt text” labels to identify elements.- Use for: Recurring reports, reusable templates
- Example: Label an element “monthly_revenue” and update it repeatedly
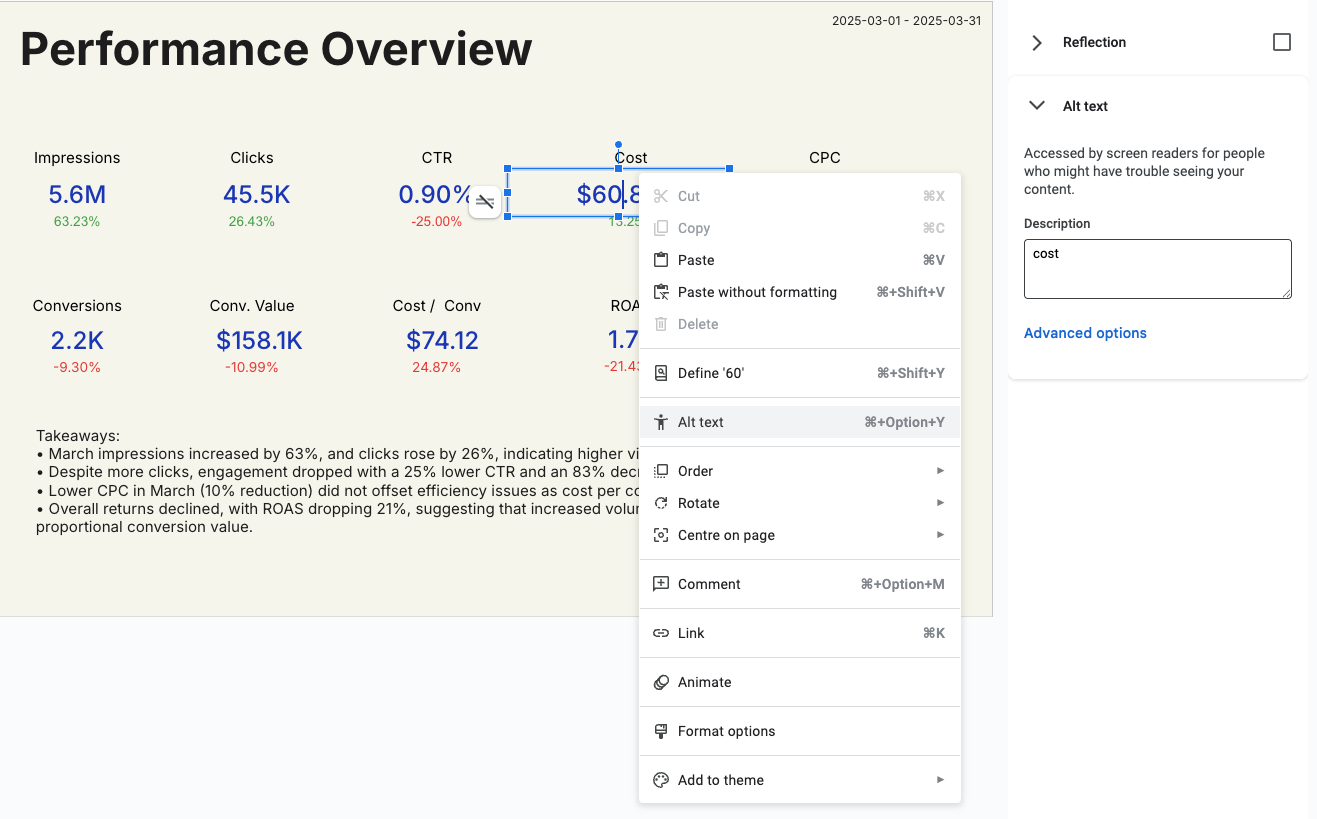
How to Add Alt Text in Google Slides
- Right-click on any text box or element
- Select “Alt text” from the menu
- If you don’t see Alt text: Click “Format options” first, then look for Alt text at the bottom
- Add a descriptive name like “campaign_spend” or “conversion_rate”
When to Use Each Search Method
| Regular Text | Alt Text |
|---|---|
| One-time updates | Recurring reports |
| Simple text changes | Template-based workflows |
| Text you won’t change again | Dynamic data that updates regularly |
| Example: Update client name once | Example: Monthly revenue updates |
Replacement Methods: Manual vs Structured Data (Bulk)
Manual Replacement
Add individual text replacements one by one. Best for:- 1-5 replacements
- Simple updates
- Quick one-off changes
- Find: “campaign_name” → Replace: “Holiday Sale”
- Find: “total_spend” → Replace: “$12,450”
Structured Data (Bulk)
Use data from previous workflow steps to make many replacements at once. Best for:- 10+ replacements
- Data from analytics reports
- Automated workflows
Examples
Manual Replacement Example
Scenario: Update a client presentation with new campaign data Setup:- Set alt text “client_name” on title
- Set alt text “campaign_budget” on budget number
- Set alt text “performance_metric” on results
client_name→ “Nike”campaign_budget→ “$25,000”performance_metric→ “152% ROAS”
Structured Data (Bulk) Example
Scenario: Monthly report with Google Ads data Your data can come in any of these simple formats:Option 1: Simple Table Format (Easiest)
Just provide your data as key-value pairs - the system automatically knows what to find and replace:| Metric | Value |
|---|---|
| cost | $15,420 |
| clicks | 12,350 |
| conversions | 145 |
| conversion_rate | 3.2% |
| cost_per_conversion | $106.34 |
Option 2: Traditional Find/Replace Format
For more control, specify exactly what to find and what to replace it with:| What to Find | Replace With | Target Slide |
|---|---|---|
| monthly_spend | $15,420 | (all slides) |
| click_count | 12,350 | 2 |
| conversion_data | 145 conversions | 3 |
Structured Data: Three Flexible Formats
The system accepts your data in multiple formats - choose what works best for your workflow:Format 1: Simple Key-Value Table (Recommended for Marketers)
Best for: Most marketing use cases - clean and simple Your data: Any table where column names match your slide’s alt textFormat 2: Single Table with Multiple Metrics
Best for: When you have all your metrics in one organized table Your data: One comprehensive tableFormat 3: Detailed Find/Replace Control
Best for: Advanced users who need precise control Your data: Specify exactly what to find and replace- ✅ Simple: Use any table format from your reports
- ✅ Flexible: Works with Google Ads, Analytics, Sheets, and any data source
- ✅ Smart: Automatically matches your data to slide elements
- ✅ No Technical Setup: Just make sure your alt text names match your data columns
Connecting Your Marketing Data
The flexible data format works seamlessly with all marketing data sources:From Google Ads
Connect a Google Ads Report node → Replace Text node- Use the data returned directly from Google Ads Get Report
- Make sure your report returns 1 row of data
- Ensure your slide alt text matches the column names (e.g., “cost”, “clicks”, “impressions”)
- Your metrics automatically update in slides
From Google Analytics
Connect a GA4 Report node → Replace Text node- Use the data returned directly from GA4 Get Report
- Configure your report to return 1 row with your key metrics
- Match your slide alt text to GA4 metric names (e.g., “sessions”, “users”, “conversions”)
- Sessions, users, conversion data flows directly to your presentation
From Google Sheets
Connect a Sheets Read node → Replace Text node- Any spreadsheet data updates your slides instantly
- Perfect for custom calculations and KPIs
From Any Platform
Connect Facebook Ads, LinkedIn Ads, TikTok Ads, or any data node- All platforms output data in compatible formats
- Mix and match data from multiple sources
- Your report returns 1 row of data
- Your slide alt text names match the column names from your report
- Example: If Google Ads returns “cost” and “clicks”, make sure you have alt text “cost” and “clicks” in your slides
Credit Cost
1 credit per successful run.FAQ
What's Alt Text?
What's Alt Text?
Alt text is a hidden label you can add to any text box or element in Google
Slides. It’s like giving each element a permanent name tag. You can use it to
identify elements for repeated updates. It’s meant for accessibility, but we
use it to make dynamic presentations easier to manage.
What's the difference between Regular Text and Alt Text modes?
What's the difference between Regular Text and Alt Text modes?
Regular Text finds and replaces visible text in your slides. Once replaced, that text is gone.Alt Text uses hidden labels you add to elements. The label stays, so you can update the same element repeatedly.Use Regular Text for one-time changes. Use Alt Text for recurring reports and templates.
When should I use Manual vs Structured Data (Bulk)?
When should I use Manual vs Structured Data (Bulk)?
Manual: 1-5 simple replacements, quick updatesStructured Data (Bulk): 10+ replacements, connecting data from analytics reports, automated workflows
How do I set up a reusable presentation template?
How do I set up a reusable presentation template?
- Create your presentation design 2. Add alt text to all dynamic elements (right-click → Alt text) 3. Use descriptive names like “monthly_revenue”, “campaign_name” 4. Save as template and reuse with different data
Can I replace text on specific slides only?
Can I replace text on specific slides only?
Yes, use the Slide Number field to target specific slides. Leave empty to
update all slides in the presentation.
What happens if the text isn't found?
What happens if the text isn't found?
If regular text isn’t found, nothing happens. If alt text isn’t found, the
replacement is skipped. Check your spelling and ensure the text/alt text
exists in your presentation.
How can I format the structured data for replacements?
How can I format the structured data for replacements?
The system accepts your data in multiple simple formats - no technical setup required:Simple Key-Value Format (Most Popular):
Any table where the column names match your slide’s alt text:
- cost → $15,420
- impressions → 62,000
- ctr → 2.4%
- What to find: “monthly_spend” → Replace with: “$15,420”
- What to find: “conversion_rate” → Replace with: “3.2%” → Target slide: 2
How do I add hyperlinks or format text in replacements?
How do I add hyperlinks or format text in replacements?
When using Alt Text mode, Replace Text supports markdown formatting in your replacement values:Bold Text:Italic Text:Clickable Hyperlinks:Combined Example:
Replace This creates: Campaign Performance: Excellent - with a clickable link to your report.Important: Markdown formatting only works with Alt Text search method, not Regular Text mode.Pro Tip: Hyperlinks are great for adding clickable CTAs or linking to dashboards directly from your slides!
campaign_summary with:I'm getting an error about multiple items or find/replace keys. What's wrong?
I'm getting an error about multiple items or find/replace keys. What's wrong?
This error happens when your data format doesn’t match what the system expects. Here’s how to fix it:Error: “When providing a list with multiple items, all items must have ‘find’ and ‘replace’ keys”Solution: You’re mixing data formats. Choose one approach:Option 1 - Simple Key-Value (Recommended):
Use a single table with your metrics:Option 2 - Multiple Find/Replace Items:
If you need multiple specific replacements, format each one properly:Don’t mix formats: Don’t combine simple key-value data with find/replace format in the same list.Quick Fix: If you’re getting this error, check your data source and make sure it’s outputting either:
- One simple table with key-value pairs, OR
- Multiple items where each has both “find” and “replace” fields