Where to View Runs
1. Logs Sidebar (Live Debugging)
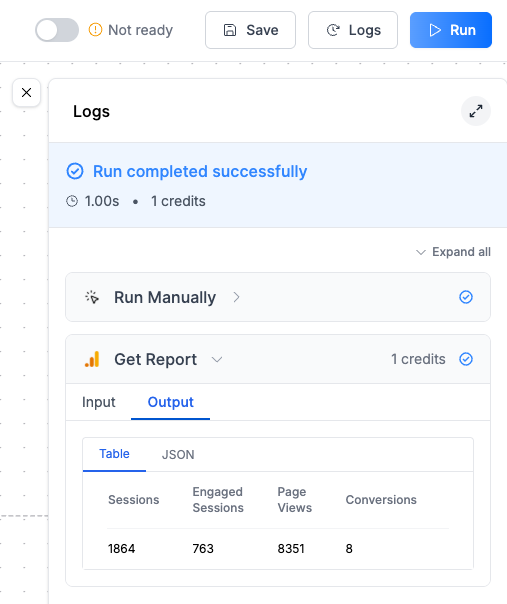
When running a workflow manually from the canvas editor:- Click Run Manually button
- The Logs sidebar opens automatically
- Shows real-time execution progress
- Click any node to see its input/output details
2. Workflow Runs Page (Historical View)
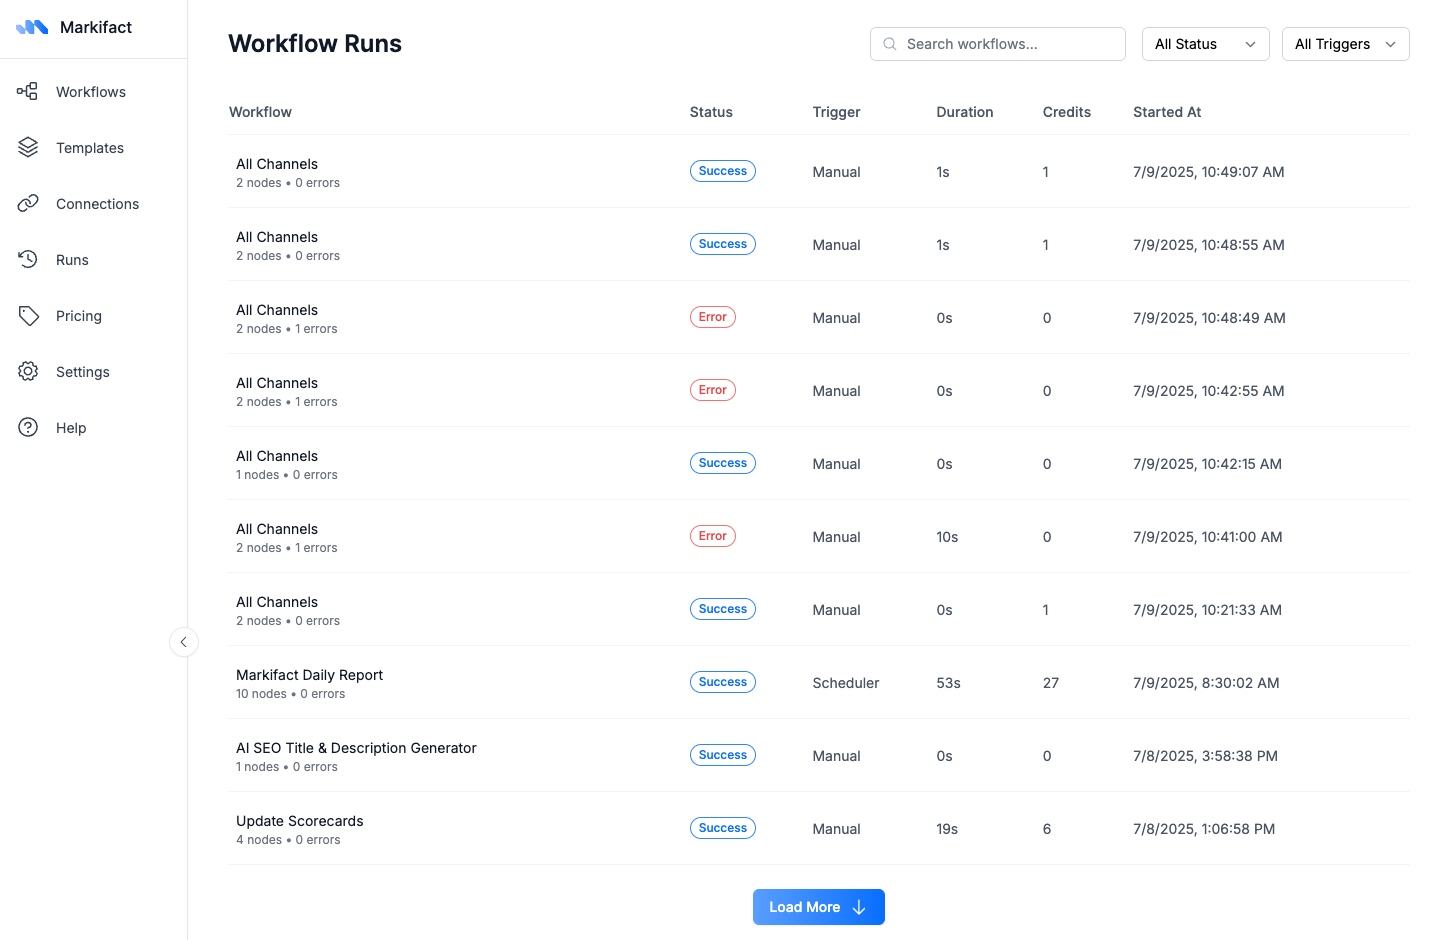
For all workflow executions (manual and triggered):- Navigate to Runs in the left sidebar
- See complete execution history across all workflows
- Filter by status, trigger type, or workflow name
- Access detailed logs for any past run
Run Information
Each run record includes:| Field | Description |
|---|---|
| Status | Success, Error, or Running |
| Trigger | How the workflow started (Manual, Scheduler, Slack, etc.) |
| Duration | Total execution time |
| Credits | Credits consumed during the run |
| Started At | Timestamp when execution began |
| Nodes | Number of nodes executed and any errors |
Failure Notifications
When a workflow fails, you’ll receive an email notification with:- Error summary - Brief description of what went wrong
- Failed node - Which specific node encountered the error
- Workflow name - So you know which automation needs attention
💡 Pro tip: The email gives you a quick overview, but always check the Runs page for complete error details and debugging information.
Log Details
Click any run to see detailed execution logs:Node-Level Logs
- Input: Data that entered each node
- Output: Data produced by each node
- Table/JSON views: Switch between formats for easier reading
- Error details: Specific error messages and troubleshooting info
Execution Flow
- See which nodes executed successfully
- Identify where workflows stopped or failed
- Track data transformation through each step
History Retention
Your execution history is kept based on your plan:| Plan | History Kept |
|---|---|
| Free | 1 day |
| Pro | 7 days |
| Team | 30 days |
💡 Tip: Download important logs or results before they expire if you need them for longer-term analysis.
Common Use Cases
Debugging Workflows
- Check the Logs sidebar when a workflow fails
- Look for red error indicators on specific nodes
- Review input/output data to identify issues
Performance Monitoring
- Track execution duration trends
- Monitor credit usage patterns
- Identify slow or expensive nodes
Data Validation
- Verify correct data is flowing between nodes
- Confirm transformations are working as expected
FAQ
Why can't I see logs for older runs?
Why can't I see logs for older runs?
Logs are automatically deleted based on your plan’s retention period:
- Free: 1 day
- Pro: 7 days
- Team: 30 days
Why do some runs show 0 credits?
Why do some runs show 0 credits?
Runs that fail before executing any nodes, or workflows that only use free operations (like simple data transformations), may show 0 credits consumed.
How do I find runs from a specific workflow?
How do I find runs from a specific workflow?
On the Runs page:
- Use the search bar to find workflows by name
- Filter by “All Triggers” to see specific trigger types
- Look at the “Workflow” column to identify runs
What does 'X nodes • Y errors' mean?
What does 'X nodes • Y errors' mean?
This shows the total number of nodes in the workflow and how many encountered errors during execution. For example, “5 nodes • 1 error” means 5 nodes total, with 1 node failing.